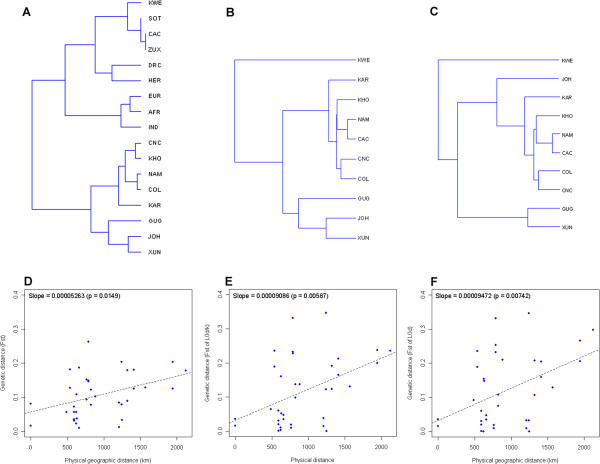
Figure 5.
Trees based on Fst and correlation of genetic distance with geographic distance between sample groups. Trees representing mtDNA Fst values between different populations in the study group for A: all mtDNA sequences B: L0d/k sequences and C: L0d sequences. D-F: Pairwise comparisons between geographic distance (X-axis) and mtDNA Fst genetic distance (Y-axis), corresponding to trees in A-C.

