Figure 1.

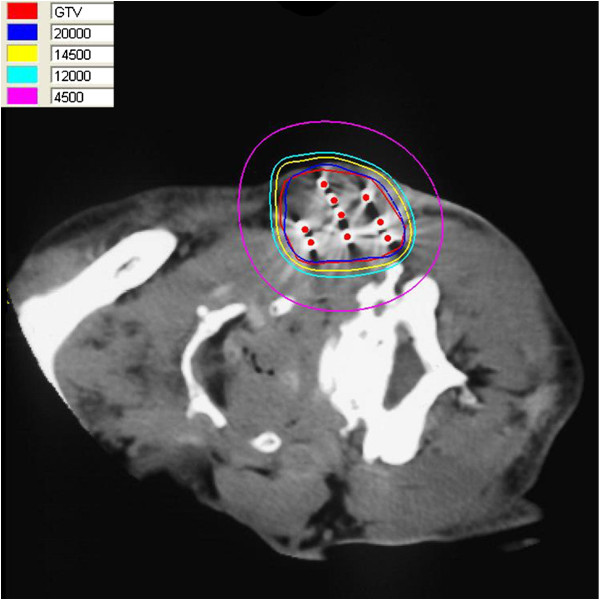
The isodose curve distribution of tumor after seed implantation from CT scan. The inner red curve represents tumor. The ellipses are iso-dose lines of 200, 145, 120 and 45 Gy from inside, respectively.

The isodose curve distribution of tumor after seed implantation from CT scan. The inner red curve represents tumor. The ellipses are iso-dose lines of 200, 145, 120 and 45 Gy from inside, respectively.