Figure 10.

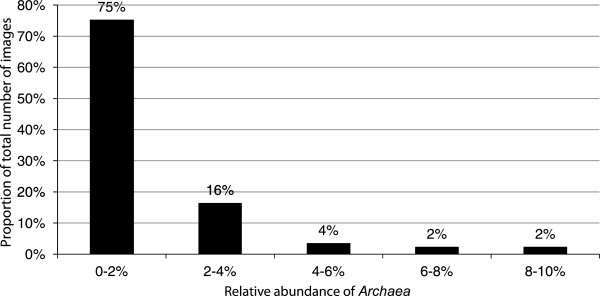
Distribution of Archaea . The proportion of the total number of confocal images for different intervals of Archaea abundance in triplicate samples from the aeration tank.

Distribution of Archaea . The proportion of the total number of confocal images for different intervals of Archaea abundance in triplicate samples from the aeration tank.