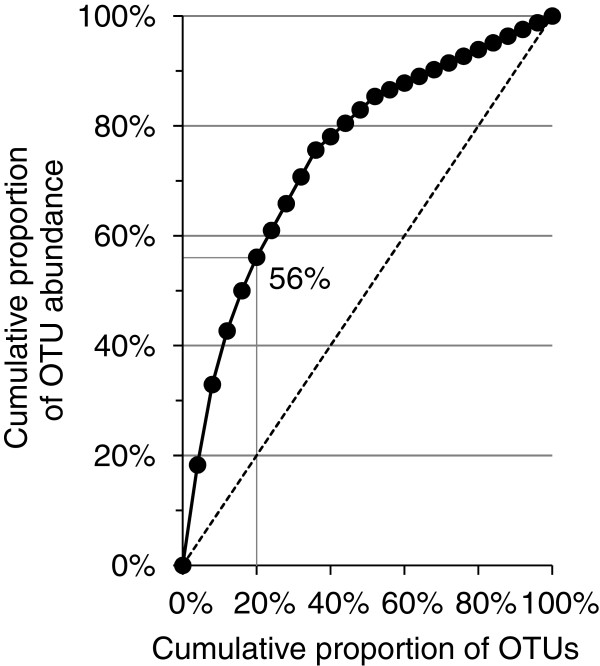
Figure 2.
Pareto-Lorenz evenness curve. 82 archaeal 16S rRNA gene sequences were divided in 25 OTUs based on a sequence similarity threshold of 98.7% and the OTUs were ranked from high to low, based on their abundance. The Pareto-Lorenz evenness curve is the plot of the cumulative proportion of OTU abundances (y-axis) against the cumulative proportion of OTUs (x-axis). The Fo index, i.e. the combined relative abundance of 20% of the OTUs, is shown. The dotted straight line is the Pareto-Lorenz curve of a community with perfect evenness.

