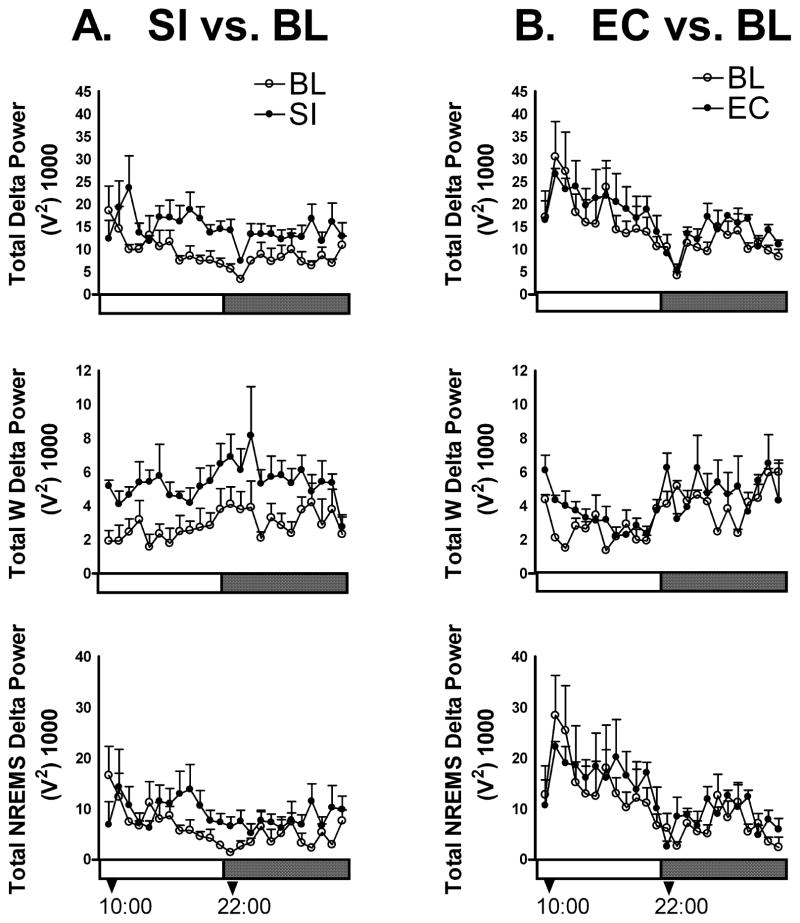
Fig. 2.
Delta power is increased during SI. (A) Sleep interruption (SI) (n = 5) results in an increase in total delta power (the amplitude of the electroencephalographic signal in the delta frequency range of 1–4 Hz). Graphs show average sum (± SEM) of delta power each hour during the lights on (clear horizontal bars) and lights off (dark horizontal bars) SI periods. There was a significant increase in total wakefulness (W) delta power (middle left), and a significant interaction of treatment × time for the NREM delta power (bottom left). (B) Exercise control (EC) (n = 3) did not produce any change in delta power during W (middle left) or NREMS (bottom right).

