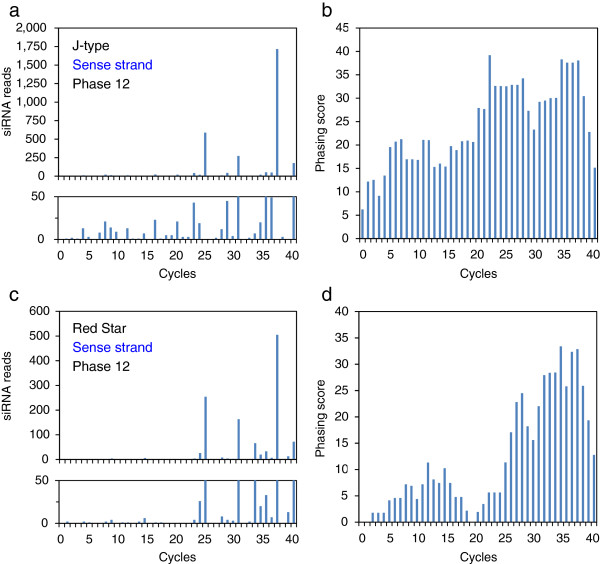
Figure 10.
Abundance of 21-nt siRNAs and phasing scores of sense strand. Data of phase 12 of sense strand siRNAs, in which total number of contiguous siRNA units was highest in J-type (see Figure 8), are shown. a, siRNA reads in J-type; b, phasing score of the data in panel a; c, siRNA reads in Red Star; d, phasing score of the data in panel c. In panels a and c, a close up of the graphs up to 50 reads are shown below. Cycle 1 corresponds to the phased siRNA mapped at the upstream end of contiguous units in J-type (Figure 8). Phasing scores are calculated according to Howell et al. (2007).

