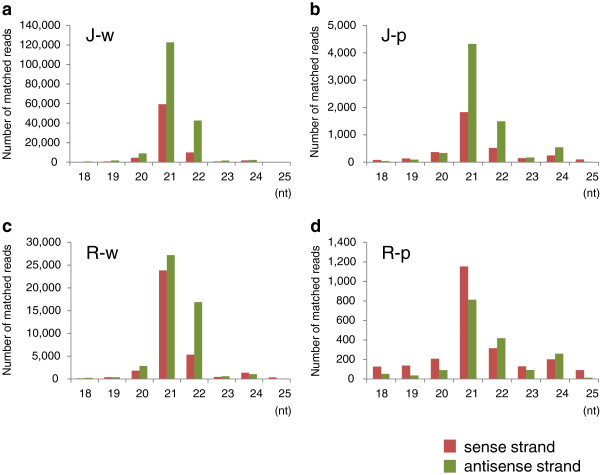
Figure 2.
Frequency of siRNAs between 18 and 25 nt mapped in the CHS-A gene from floral tissues of petunia. (a) White and (b) pigmented tissues of J-type plants, (c) white and (d) pigmented tissues of Red Star plants. Number of siRNAs mapped on the sense strand (red bars) and antisense strand (green bars) are indicated.

