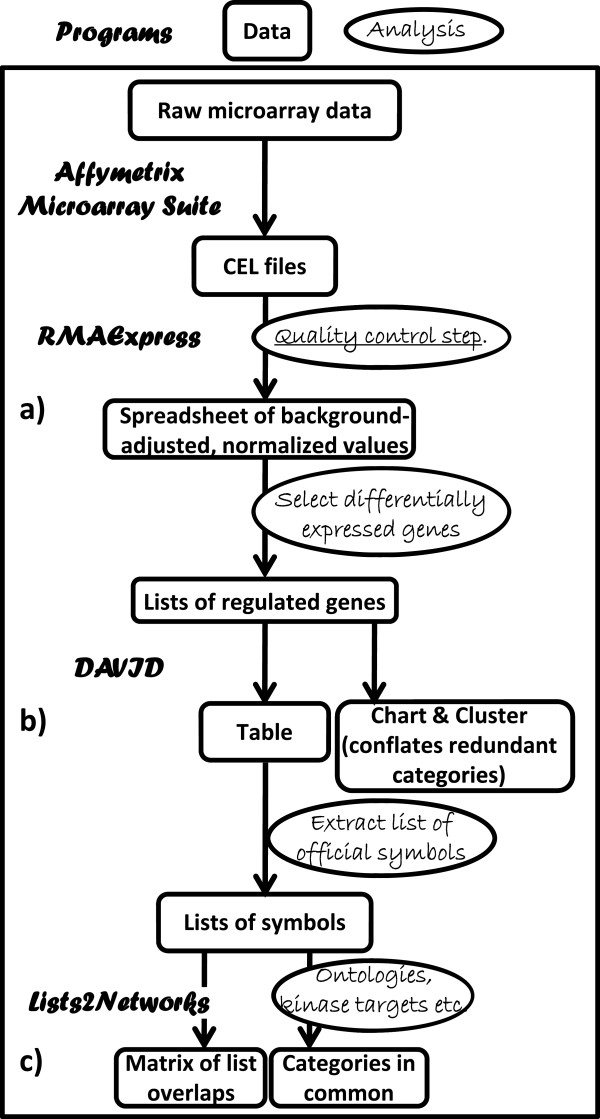
Figure 5.
Flowchart of analysis. The data flow from rectangle to rectangle; the programs are named in bold italics and the analyses to be performed by the investigator using spreadsheet are in ovals. a) An example of large spreadsheets is given in Additional file 1: Table S1. b) An example of Tables is given in Additional file 2: Table S3, of Charts in Table 1 and of Clusters in Additional file 5: Table S2. c) An example of Matrices is given in Figure 2, of Kinase Targets in Table 5 and of Ontological Categories in common in Table 7.

