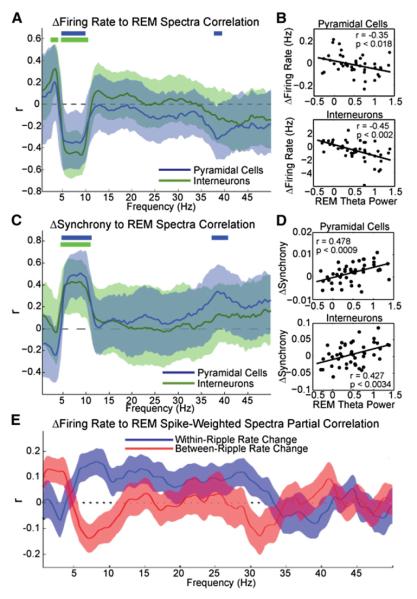
Figure 4. REM Sleep Affects Firing Patterns in Non-REM.
(A) Correlation values between firing rate changes between non-REMn and non-REMn+1 episodes versus LFP power of the intervening REM (mean and 95% confidence intervals) in the 0–50 Hz frequency range. Top solid bars indicate frequency bands in 0.25 Hz steps of significant correlation. Note significant effect of REM theta power on rate changes between successive non-REM episodes for both pyramidal cells and interneurons. (B) Mean firing rate changes (Hz) between non-REMn and non-REMn+1 episodes (y axis) as a function of the theta power during the interleaving REM episode. Power during REM was normalized by the power of concatenated non-REM episodes (Z score). (C and D) Same as (A) and (B), respectively, but for synchrony change (pairwise correlation) between successive non-REM episodes. (E) Correlation values between firing rate changes across sleep and spike-weighted spectra (SpWS; see Supplemental Experimental Procedures) during REM for pyramidal cells in the 0–50 Hz frequency range. Results are shown separately for spikes that occurred between ripples (red) and in within-ripple (blue) events.

