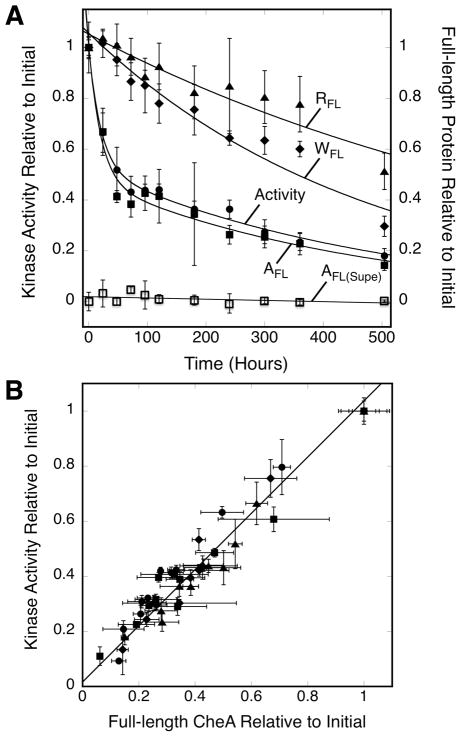
Figure 3.
Comparing the kinetics of kinase activity loss and protein loss. A) Triplicate, membrane-bound arrays reconstituted from serine receptor, CheA kinase and CheW coupling protein were incubated at 22°C for 504 hrs (21 days). At the indicated timepoints a sample was removed from each triplicate and mixed with CheY and ATP to determine the kinase activity of the array (circles). Another sample was pelleted to separate and quantitate array bound CheA (closed squares) and CheA in the supernate (open squares). Pelleted samples were also utilized to quantitate array bound, full-length CheW (diamonds) and full-length Tsr (triangles). The data were best fit with the double exponential decay of Eq. 1 yielding the indicated best fit curves (kinase activity and pellets), or were best fit with a straight line (supernatant). B) Plot investigating the correlation between the average kinase activity and level of full length CheA measured at a given timepoint for each triplicate in (A), as well as 3 other independent experiments like (A). Error bars indicate the standard deviation of the triplicate mean for each parameter.

