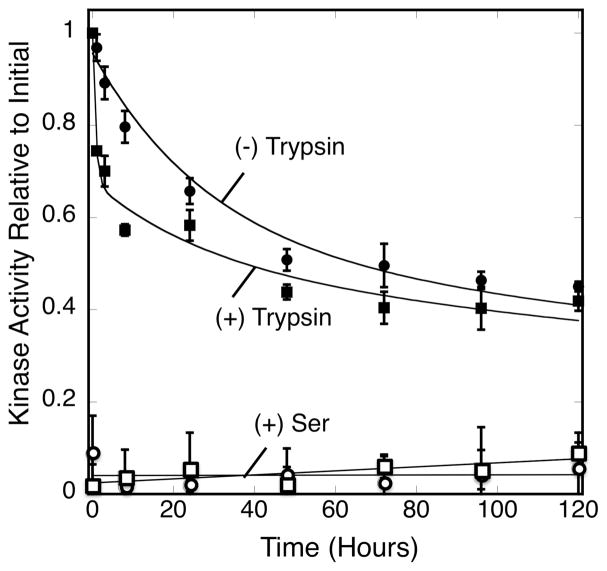
Figure 5.
Kinetic comparison of endogenous and exogenous proteolysis. Triplicate, membrane-bound arrays reconstituted from serine receptor, CheA kinase and CheW coupling protein were incubated at 22°C for 120 hrs (5 days) under normal conditions (filled circles) or with 3 nM trypsin (filled squares). Atthe indicated timepoints a sample was removed from each triplicate and its kinase activity was determined in the absence (filled circles, squares) or presence (open circles, squares) of attractant serine. Error bars indicate the standard deviation of each triplicate mean. The (−) trypsin data (curve) were best fit by Eq. 2, a variation of the double exponential decay of Eq. 1 where the lifetime (τf and τs) was fixed (29 and 460 hours) to the averages obtained from Figure 1., Eq. 1. The (+) trypsin data (curve) were best fit by Eq. 3, a variation of Eq. 2 that contained a third exponential term that was not fixed to any predetermined value.

