
Figure 1.
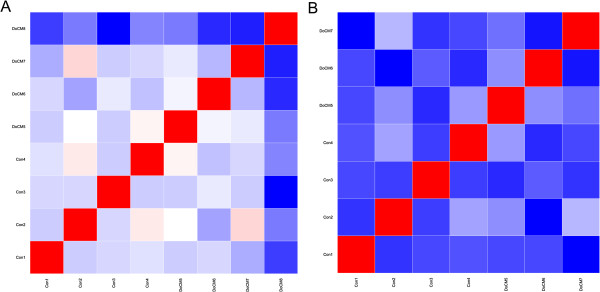
Matrix of pairwise correlations. Red coefficient of correlation = 1, blue = lowest values; 1A: Correlation matrix showing all samples. Color intensity of DoCM8 is markedly different to other columns indicating strong differences of expression levels compared to other samples. Strong blue colored boxes are illustrating much lower correlation compared to light colored boxes of the other samples. 1B: Correlation matrix after exclusion of DoCM8. All boxes are colored similarly indicating uniform variation between all samples. DoCM: DCM in Doberman Pinschers; Con: Control.