
Figure 3.
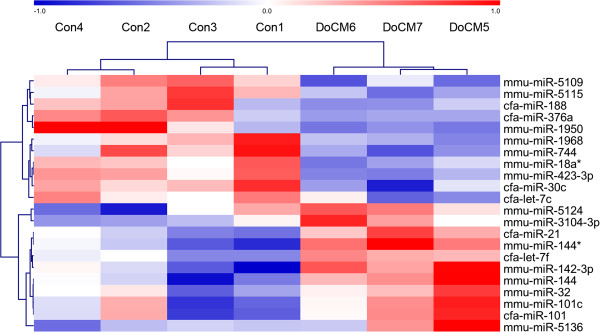
Hierarchical cluster analysis (HCL support tree) summarizing miRNA expression differences. Each column represents 1 of 7 samples, each row represents 1 of 22 miRNAs with nominal p-values <0.05. Samples were reproducibly grouped in DoCM and controls after unsupervised hierarchical clustering (MeV 4.7.1, Pearson correlation, HCL support tree, 200 iterations). The different colors of the tree visualize the reliability of branching (black: 100%, grey: 90–100%, blue: 80–90%, green: 70–80%, yellow: 60–70%, ocher: 50–60%, magenta: 0–50%, red: 0% support). Red and blue (rectangles) indicating higher and lower expression levels, respectively, relative to the mean of all samples (log2 mean-centered expression values); DoCM: Dilated Cardiomyopathy in Doberman Pinschers; Con: Control; cfa: canis familiaris, mmu: mus musculus, miR: microRNA.