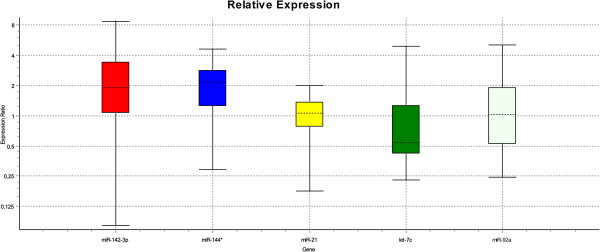
Figure 4.

Whisker-Box Plots showing expression ratios of miRNAs in the qPCR. Expression ratios in the diseased group were compared to healthy control and normalized to the control assays hs_RNU6B and hs_RNU1A. miR-142-3p and miR-144* were up regulated about two-fold in the DCM group compared to the control group, while let-7c appears to be slightly down regulated. The long whiskers represent the high interindividual variance of expression. Expression ratio of miR-92a and miR-21 is nearly 1. No statistically significant differences between the groups are evident. The dotted line in the box are representing the sample median, the bottom and the top of the box are representing the 25th and 75th percentile and the whiskers are displaying the outer 50% of observations. miR: microRNA.
