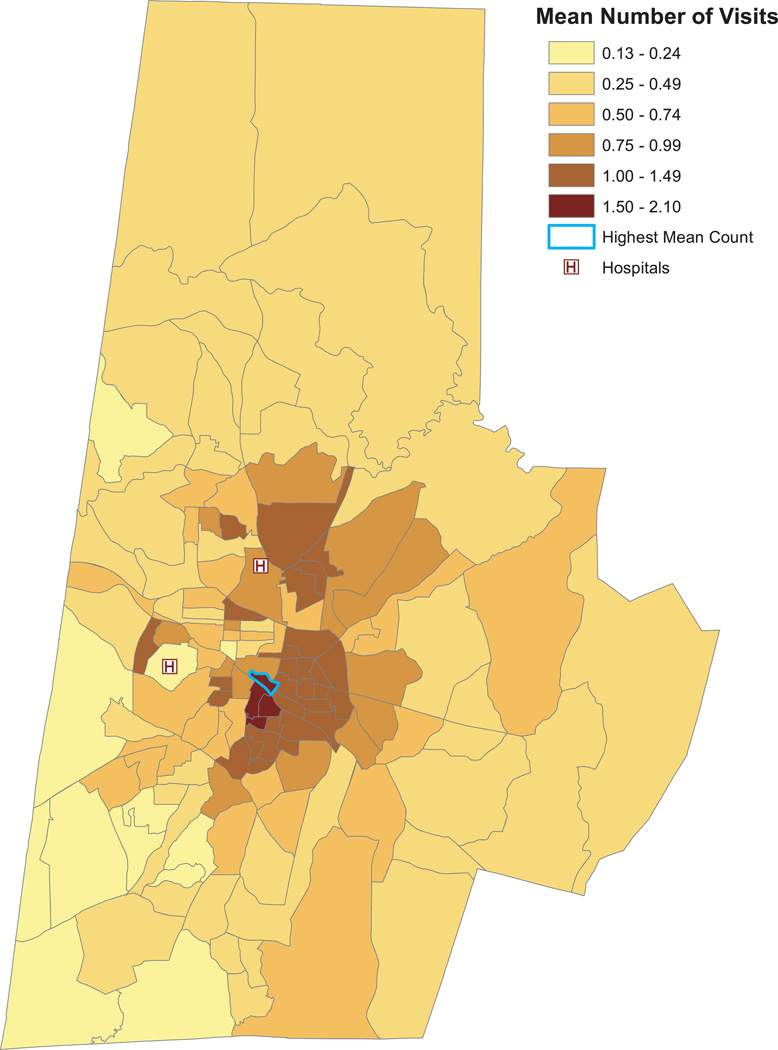
Fig. 2.
Mean number of ED visits in 2009 by block group. The locations of Duke University Medical Center and Durham Regional Hospital are represented by \H". Color shades correspond to sextiles of the count distribution rounded to the second decimal place. The block group outlined in blue has the highest average count (2.10 visits annually per patient).

