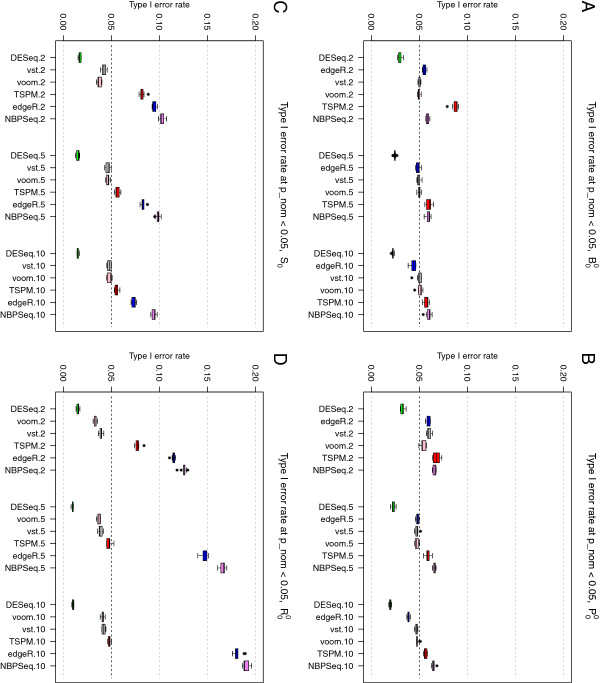
Figure 3.
Type I error rates. Type I error rates, for the six methods providing nominal p-values, in simulation studies (panel A), (panel B), (panel C) and (panel D). Letting some counts follow a Poisson distribution (panel B) reduced the type I error rates for TSPM slightly but had overall a small effect. Including outliers with abnormally high counts (panels C and D) had a detrimental effect on the ability to control the type I error for edgeR and NBPSeq, while DESeq became slightly more conservative.

