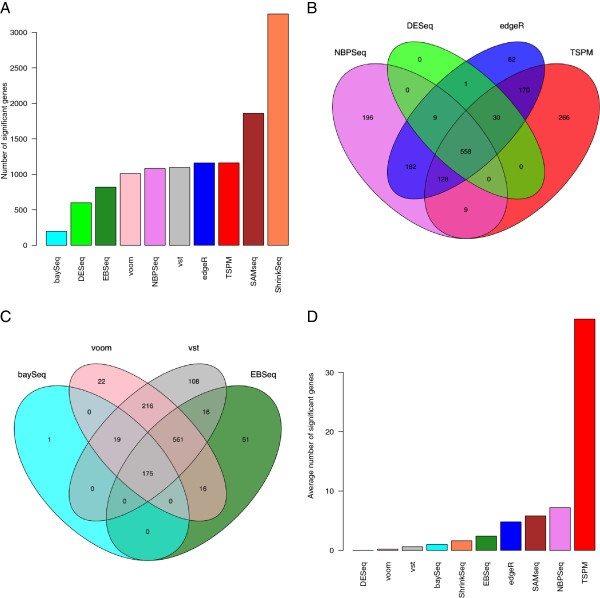
Figure 5.
Analysis of the Bottomly data set. A: The number of genes found to be significantly DE between the two mouse strains in the Bottomly data set. B-C: Overlap among the set of DE genes found by different methods. D: The average number of genes found to be significantly DE genes when contrasting two subsets of mice from the same strain, in which case we expect no truly DE genes.

