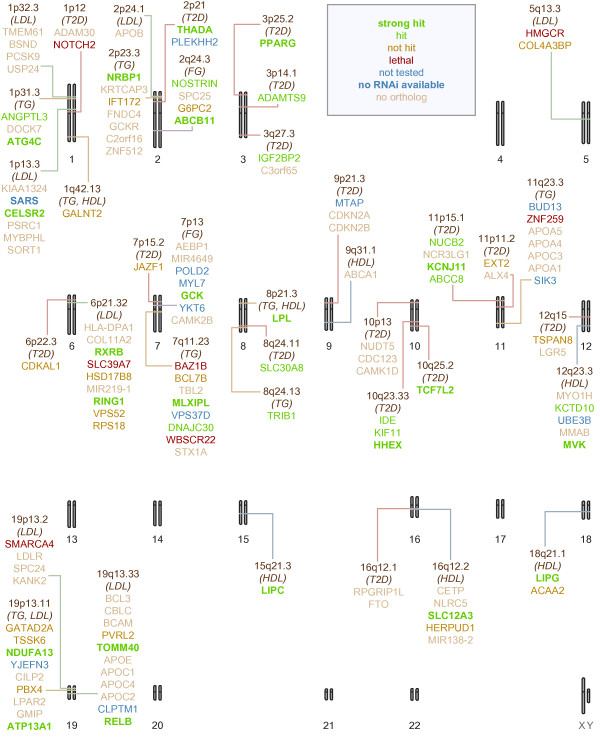
Figure 2.
Graphical summary of the Drosophila sucrose-intolerance screen. The 38 regions of interest, and the human genes located in them, are marked on a schematic karyogram of the human genome. The regions are labeled with the metabolic traits with which they are associated. The gene names are color-coded to indicate their outcome in our screen. More complete details are in Additional file 1: Table S1.

