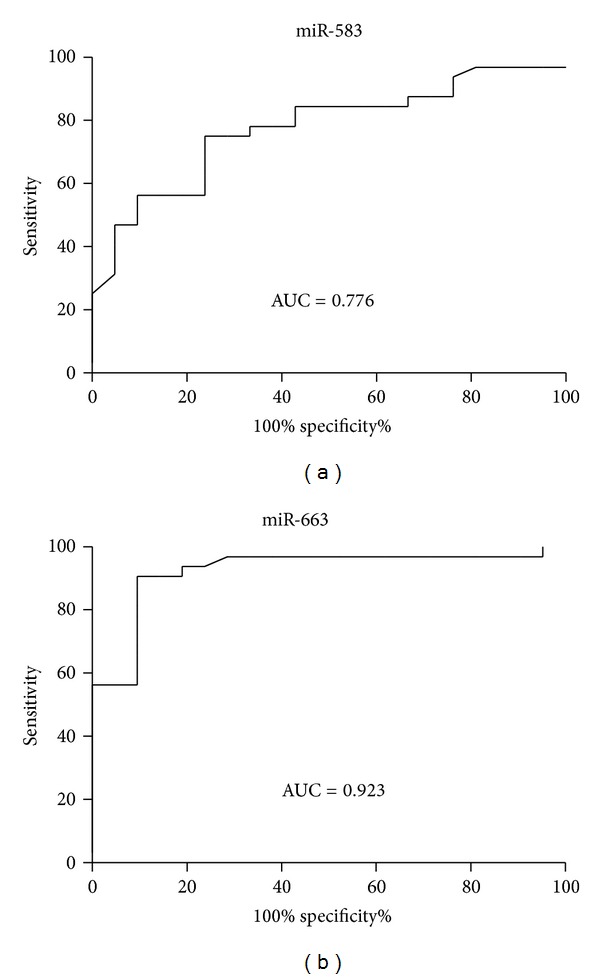
Figure 2.

ROC curve for classification of two different TCM syndromes in CHB patients. It was generated combining the levels of serum miR-583 and miR-663. (a) ROC curve for classification of LGDHS and LKYDS. AUC (area under the curve) = 0.776. (b) ROC curve for classification of LGDHS and LKYDS. AUC = 0.923.
