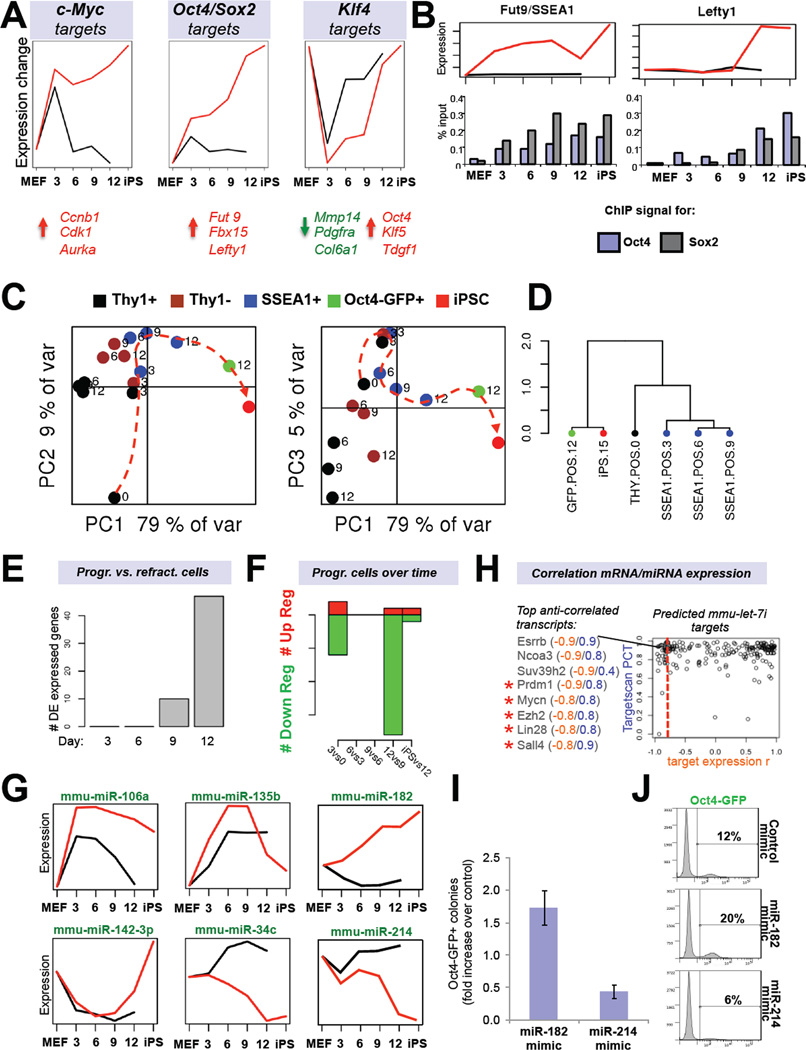
Figure 4. Predicted reprogramming factor activities and microRNA expression dynamics (see also Figure S3).
(A) Transcription factor (TF) activities for c-Myc, Klf4 and the Sox2-Oct4 dimer based on network component analysis. Shown below are examples of activated (red) or repressed (green) targets. (B) Expression dynamics of an early (Fut9; left panel) and late (Lefty1; right panel) Oct4/Sox2 target during reprogramming. Shown below is promoter ChIP analysis for Oct4 and Sox2. (C) Principle component analysis of microRNA expression data of FACS-sorted subpopulations at the indicated time points. (D) Unsupervised hierarchical clustering of indicated microRNA expression profiles. (E) Number of differentially expressed (DE) microRNAs between Thy1+ and SSEA1+ cells at indicated time points. (F) Number of differentially expressed microRNAs between progressing SSEA1+ cell populations at successive time points. (G) Examples of microRNA profiles that change in dynamic patterns. (H) Predicted target genes of let-7c (Targetscan database) are shown based on inverse expression patterns with let-7c. Examples of putative targets with an inverse expression score of −0.8 or higher are shown. Targets marked by red asterisks have previously been validated. (I) iPSC formation efficiencies and (J) Oct4-GFP FACS quantification of reprogrammable MEFs treated with mimics for miR-182 or miR-214. Data are represented as mean +/− S.E.M. (n=3).

