
Figure 5.
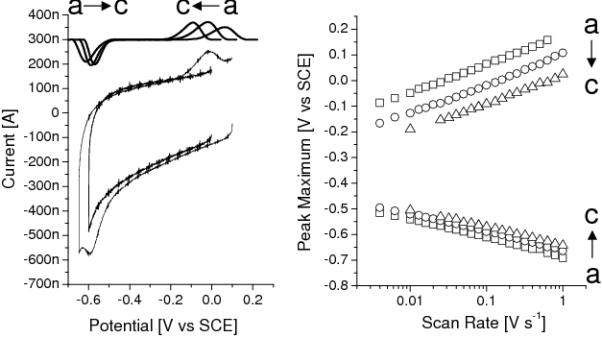
(left) CV (100 mV/s) of a electrode modified with EO3-cholesteryl:6-mercaptohexanol (30:70) before and after adsorbtion of membrane vesicles (20° C). (left, top) Background subtracted signals (offset 300 nA) at different temperatures. (right) Peak positions at different scan rates (i.e., a ‘Trumpetplot’)[37]. [(a) 5, (b) 20 and (c) 35° C]