Figure 16.

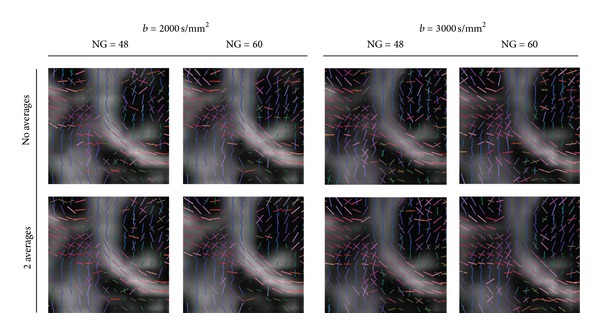
The effect of the averaging of the data at l = 4 represented by the maxima detected from Q-ball glyphs. There is not a significant difference between the quality of the data without and with averaging even at higher b-values.

The effect of the averaging of the data at l = 4 represented by the maxima detected from Q-ball glyphs. There is not a significant difference between the quality of the data without and with averaging even at higher b-values.