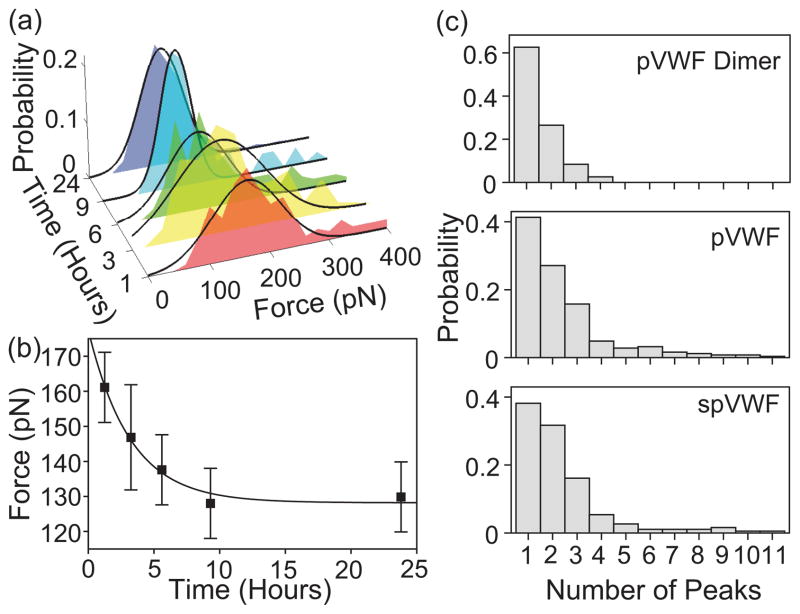
FIG. 3.
Dynamics of VWF multimers. The data were taken at 1000 nm/s pulling velocity. (a) Peak force distributions of spVWF as a function of time since exposure to a pathological level of 100 dyn/cm2 fluid shear. (b) spVWF peak force decreases with time since shear exposure. The solid line is a fit to an exponential curve, F (t) = Fp + (Fs − Fp) exp(−t/τ) (see text). The error bars are half of the bin width in the histogram. (c) Number of unfolding peaks in a given force curve from different forms of VWF multimers. pVWF dimer has up to four force peaks, indicating that there are two unfolding events per monomer.

