Figure 1.

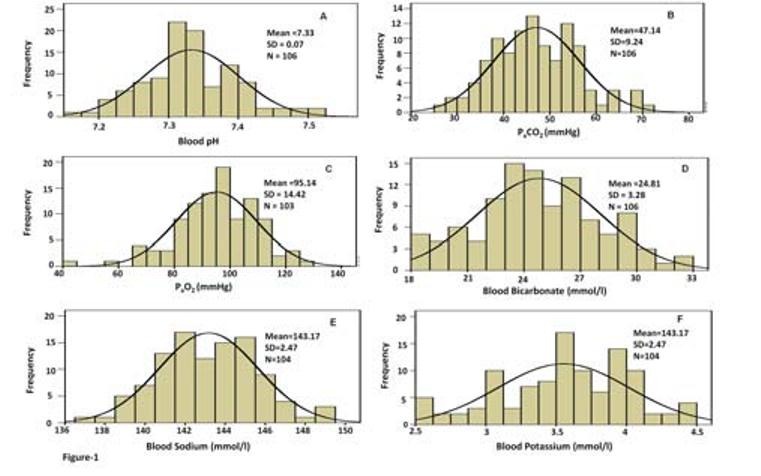
Histogram showing the frequency distribution of values. This shows that the distribution of values almost follows a normal Gaussian curve. A) Blood pH; B) PaCO2; C) PaO2; D) Sodium; F) Potassium

Histogram showing the frequency distribution of values. This shows that the distribution of values almost follows a normal Gaussian curve. A) Blood pH; B) PaCO2; C) PaO2; D) Sodium; F) Potassium