
Figure 4.
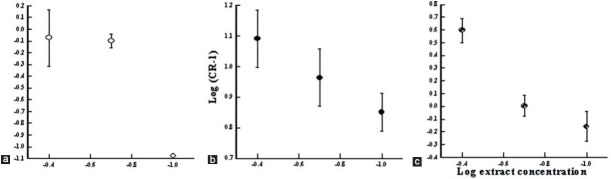
The Schild plot, log (CR-1) against log extract concentrations in (a) non incubated trachea (open symbols, group 1), (b) incubated trachea with 1 μM chlorpheniramine and 1 μM propranolol (filled symbols, group 2) and (c) tracheal chains incubated with propranolol (open symbols with a dot, group 3). The slopes of Schild plot for the extract was .-0.568, -0.837 and -0.761 for group 1, 2 and 3 respectively