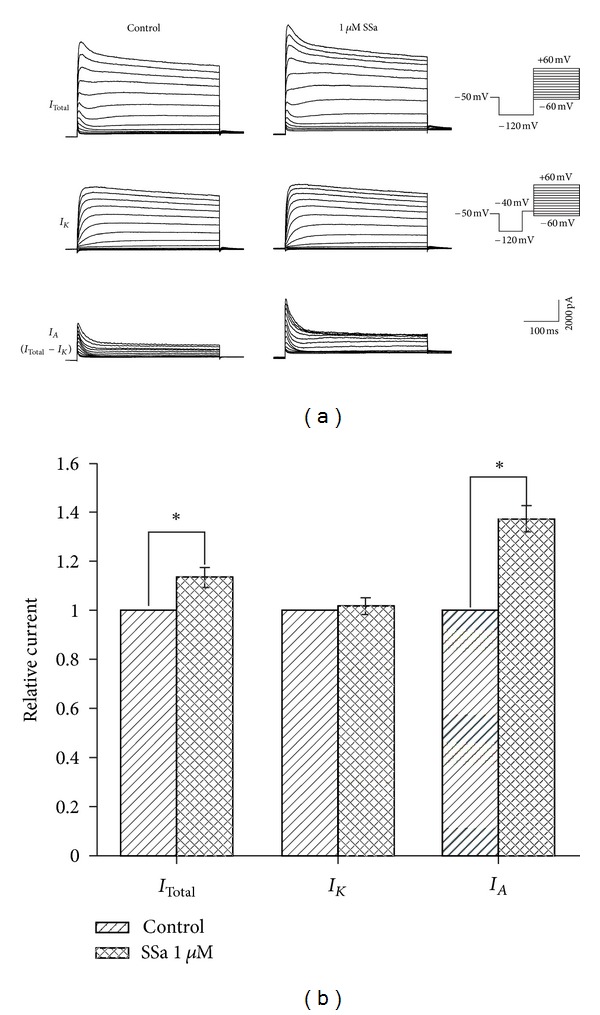
Figure 3.

Effects of SSa on I Total, I K, and I A. (a) Typical traces of three voltage-gated outward K+ currents, namely I Total, I K, and I A, before (control, left panel) and after (middle panel) application of 1 μM SSa. The pulse protocols are shown on the right. I A was determined by point-by-point subtracting I K from I Total. (b) Bar graph showing the effects of SSa (1 μM) on I Total, I K, and I A by normalizing the peak currents to the control under each condition. Data are represented as mean ± SEM (n = 8). *P < 0.05 (versus control).
