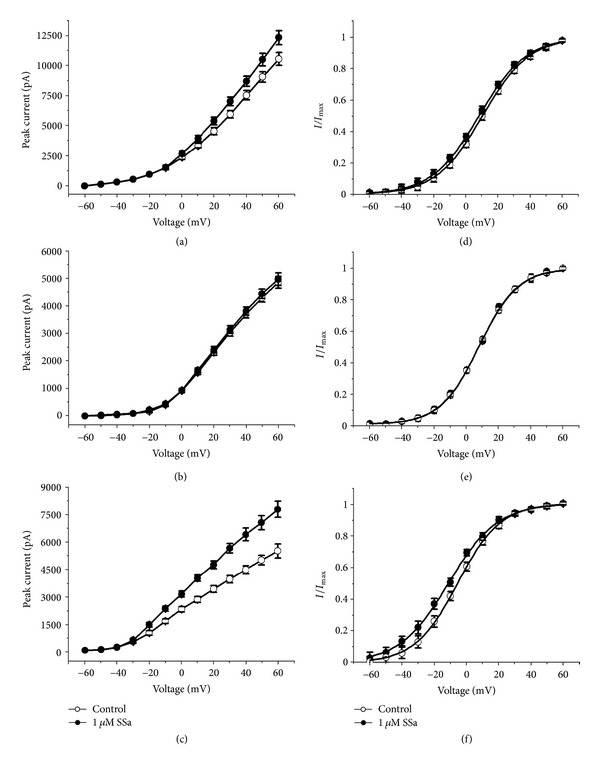
Figure 4.

Effects of SSa on I-V relationship and the activation kinetics of I Total, I K, and I A. (a, b, c) I-V relationships for I Total, I K, and I A, respectively, before and after application of 1 μM SSa. (d, e, f) Steady-state activation curves for I Total, I K, and I A, respectively, determined by the Boltzmann equation under control conditions and after application of 1 μM SSa. Data are represented as mean ± SEM (n = 8). *P < 0.05 (versus control).
