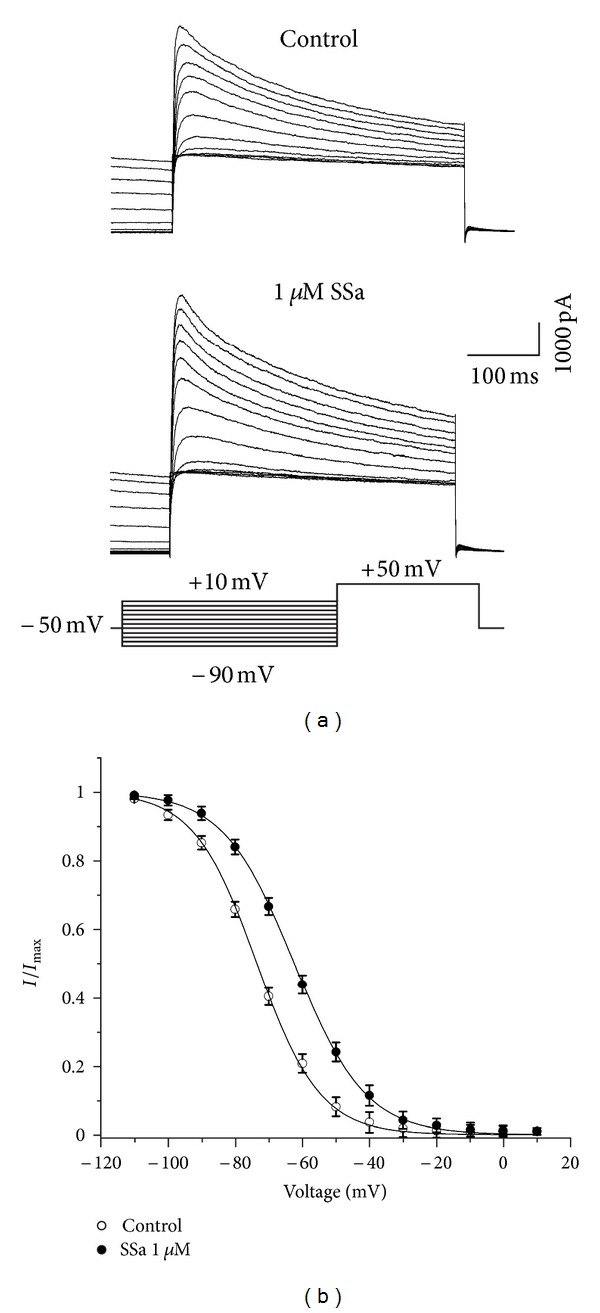
Figure 5.

Effects of SSa on the steady-state inactivation properties of I A. (a) Typical traces of I A, under control condition (top panel) and after application of 1 μM SSa (middle panel). Currents were elicited with a series of 120 ms prepulses at different hyperpolarizing potentials between −90 mV and +10 mV in 10 mV increments, followed by an 80 ms depolarizing pulse to +50 mV, delivered every 10 s (bottom panel). Currents at the end of the depolarizing pulse represented I A. (b) The steady-state inactivation curves for I A in the absence and presence of 1 μM SSa. The peak amplitudes of I A were normalized and plotted against the prepulse potentials and the data were fitted with the Boltzmann function. Data are represented as mean ± SEM (n = 8). *P < 0.05 (versus control).
