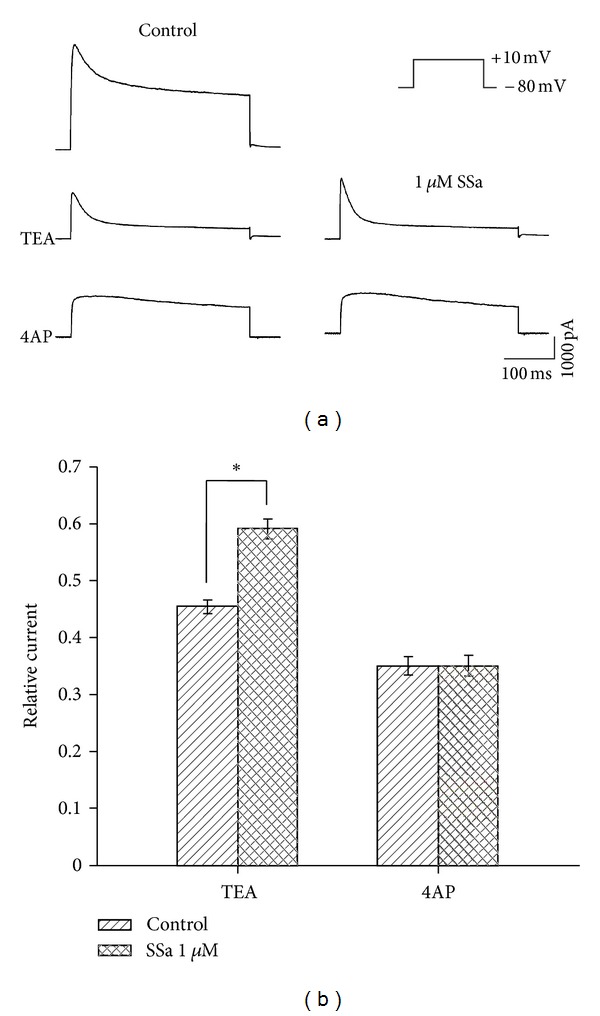
Figure 6.

Effects of SSa on 4AP-sensitive and TEA-sensitive K+ currents. (a) Representative recordings from a hippocampal CA1 neuron before (left panel) and after applying 1 μM SSa (right panel) during application of 20 mM TEA (middle panel) or 4 mM 4AP (bottom panel). Outward K+ currents were induced by a depolarizing command from −80 mV to +10 mV (right of top panel). (b) Bar graph showing the effects of SSa (1 μM) on 4AP-sensitive and TEA-sensitive K+ currents by normalizing the peak currents with control under each condition. Data are represented as mean ± SEM (n = 8). *P < 0.05 (versus control).
