
Figure 4.
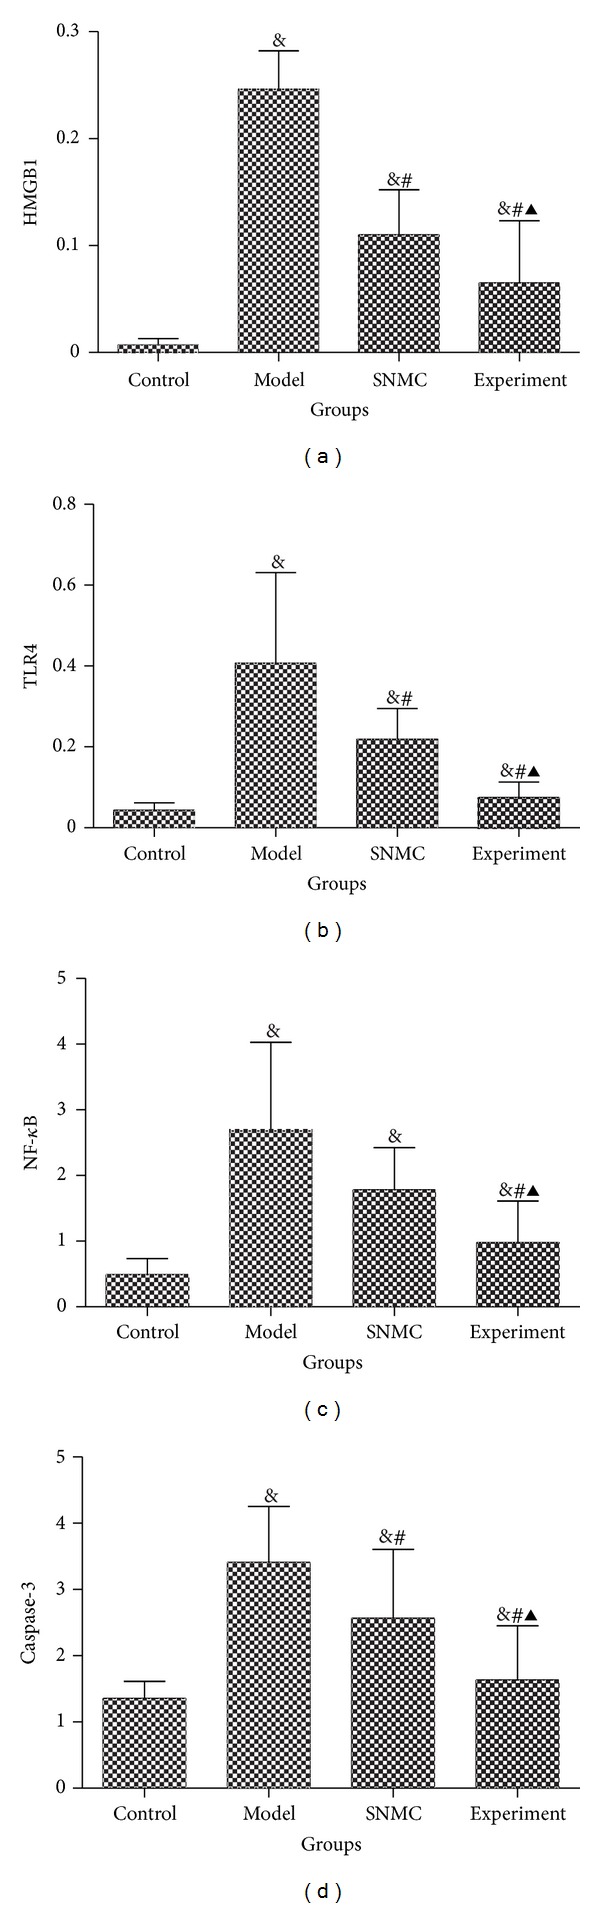
The mRNA expression. (a) HMGB1; (b) TLR4; (c) NF-κB; (d) Caspase-3. Control: negative control group; Model: the group injected with D-GalN; SNMC: the group injected with D-GalN and treated with Stronger Neo-Minophagen C; Experiment: the group injected with D-GalN and treated with Qinggan Huoxue Recipe. For Control, Model, SNMC, and Experiment groups, the HMGB1 mRNA expressions were 0.01 ± 0.01, 0.25 ± 0.04, 0.11 ± 0.04, and 0.07 ± 0.06, respectively; the TLR4 mRNA expressions were 0.04 ± 0.02, 0.41 ± 0.22, 0.22 ± 0.08, and 0.08 ± 0.04, respectively; the NF-κB mRNA expressions were 0.49 ± 0.25, 2.68 ± 1.35, 1.78 ± 0.64, and 0.98 ± 0.63, respectively; and the Caspase-3 mRNA expressions were 1.36 ± 0.26, 3.41 ± 0.85, 2.57 ± 1.04, and 1.64 ± 0.81, respectively. & P < 0.05 comparing Control group, # P < 0.05 comparing Model group, and ▲ P < 0.05 comparing SNMC group.