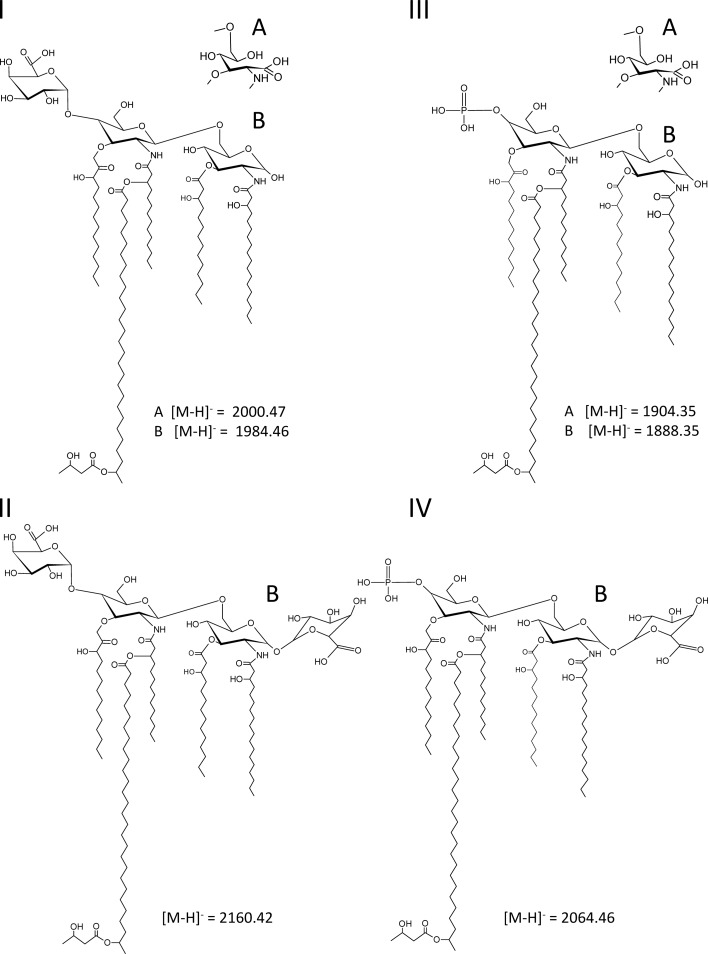
Fig. 4.
The lipid A structures for the most abundant ions determined by MALDI-TOF MS (Figures 3 and 5 and Table II). Displayed are the major lipid A structure observed for (I) strain CE3, (II) strain ODB32, (III) strain CS506 and (IV) strain ODB33. Structures “A” are due to lipid A with proximal GlcNonate and structures “B” represent lipid A with proximal GlcN. Compositions are given in Table III and mass-to-charge ratio values are highlighted in bold.

