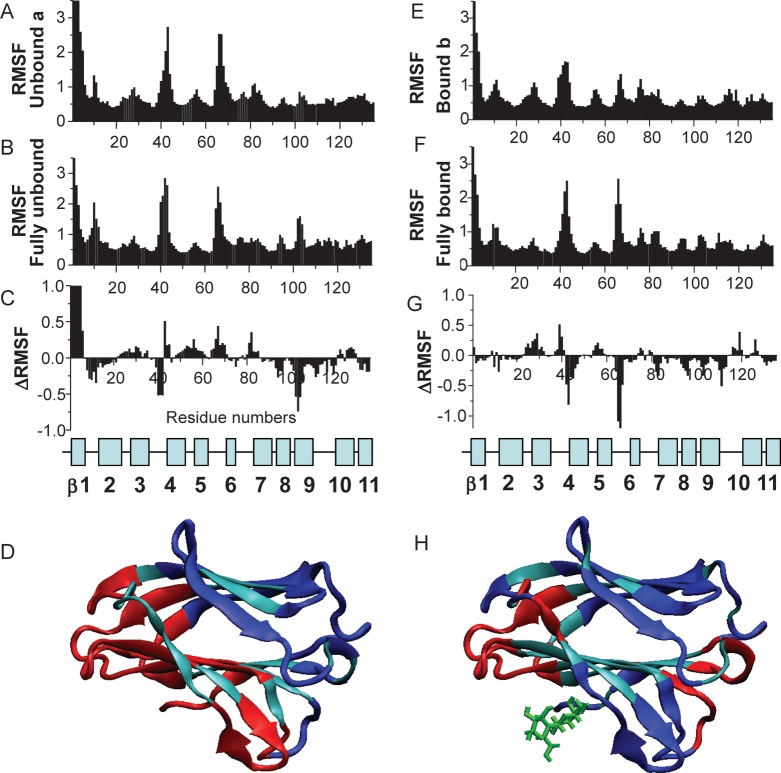
Fig. 5.
RMSF values for Cα atoms are shown for ligand-free subunit a, when one lactose moiety is associated with subunit b (A); for the average of completely ligand-free Gal-7 (B) and for the difference A minus B (C). The position of β-strands and loops in Gal-7 is shown below. (D) The changes of RMSF values are highlighted for subunit a of the half-loaded Gal-7 state. The blue and red colors indicate decreasing and increasing RMSF values, respectively, as a result of ligand binding. Unaffected residues are shown in cyan. RMSF values for Cα atoms are shown for the ligand-loaded subunit b in the half-loaded state (E); for the average of fully loaded (galactose) Gal-7 (F) and for the difference E minus F (G). The position of β-strands and loops in Gal-7 is shown below. (H) The changes of RMSF values are highlighted for subunit b of the half-loaded Gal-7 state. The blue and red colors indicate decreasing and increasing RMSF values, respectively.

