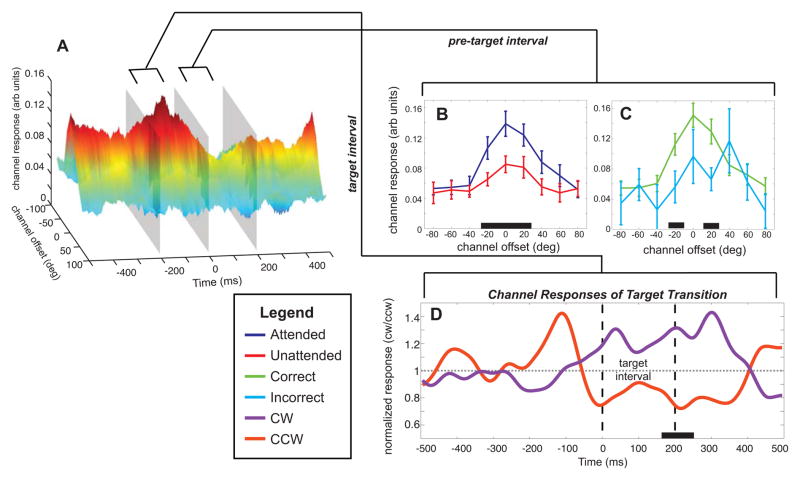
Figure 4.
(A) Rotated view of Figure 3D (correct attended trials). Each inset line plot shows the tuning functions derived from the time window 200ms before target onset (B, C). These line plots display the effect of attention (B) and the effect of accuracy (C). Significant differences between channel responses indicated by black bars on the x-axis. (D) Normalized response in channels tuned 20° and −20°) separated by clockwise or counterclockwise target shifts. These responses show a shift in the response beginning 60ms before target onset extending 400 ms after target onset. Significant divergence occurs between 165 and 255 ms after target onset (black bar on x-axis).

