
Figure 1.
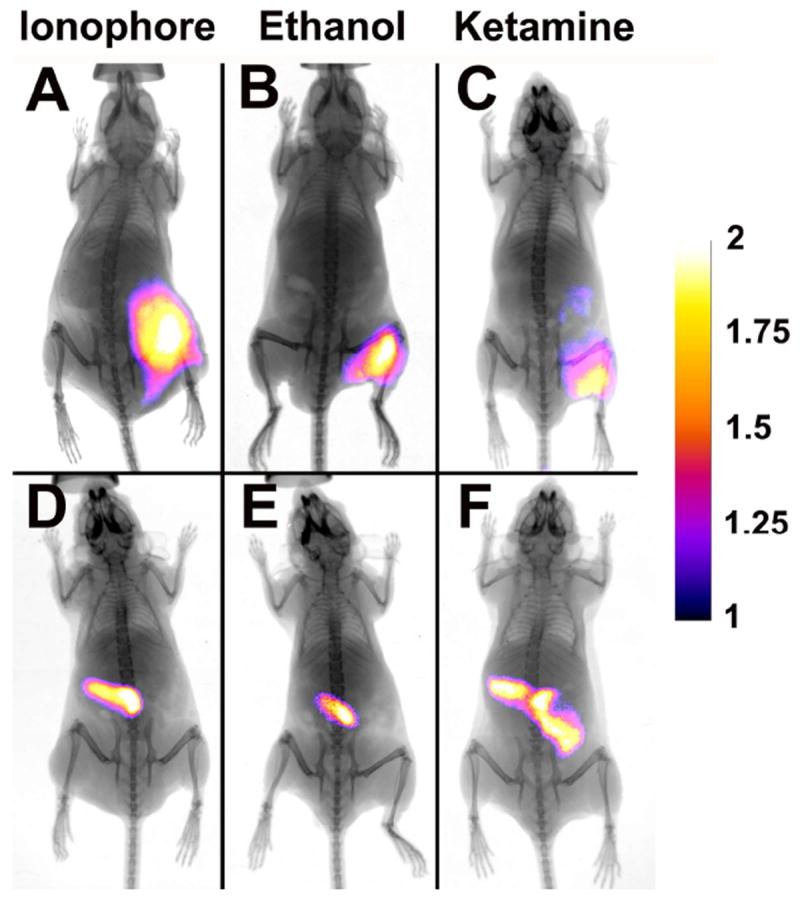
X-ray and fluorescence overlay images of mice treated with either synthetic ionophore 1, ethanol, or ketamine and dosed with probe 2 (A-C) or control 3 (D-F). Images were acquired 24 h post-injection of the probes. The calibration bar shows the fold increase in fluorescence counts from the minimum fluorescence counts. See Fig. S9 for raw data.