
Figure 3.
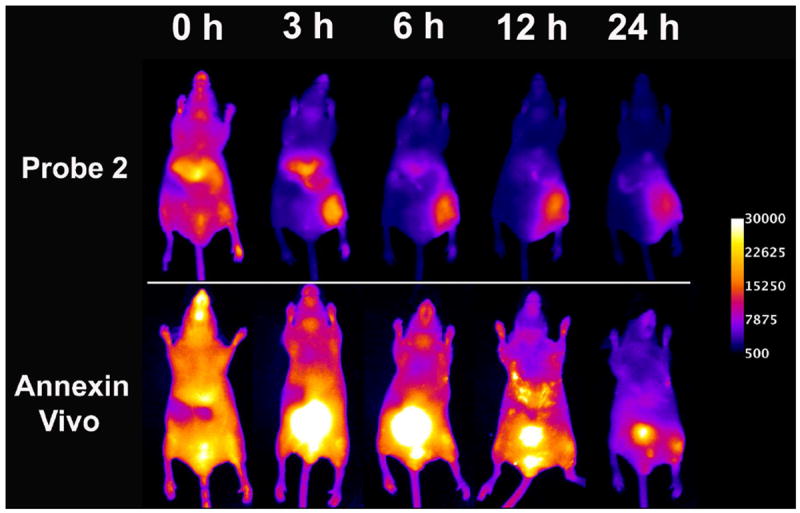
Representative near-infrared fluorescence images of a mouse treated with ionophore 1 in the hind leg and injected with either probe 2 (top row) or Annexin-Vivo 750 (bottom row) via the tail vein. Both cohorts of mice were injected with ionophore 1 in the right hind leg muscle and saline in the left hind leg muscle. The mice were dosed with either probe 2 or Annexin-Vivo 750 two hours post-treatment. Images were acquired at the indicated time points after probe injection. Calibration bar applies to all images.