
Figure 4.
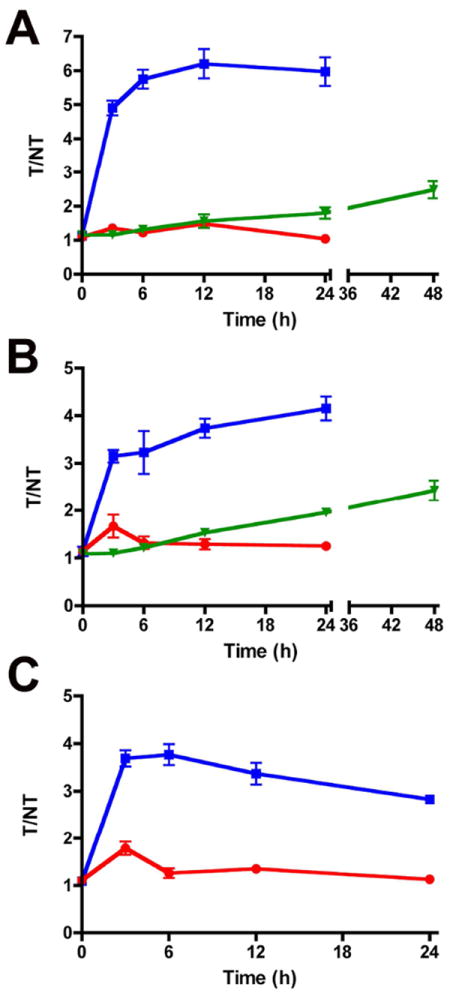
T/NT ratios of probe 2 (■), control 3 (●), and Annexin-Vivo 750 (▼) in ionophore (A), ethanol (B), and ketamine (C) treated mice. T/NT ratios were calculated at each time point for each cohort tested. Error bars represent the standard error of the mean. Data values are presented in Table S1. N =4, except n = 3 for probe 2 in B. P < 0.006 for probe 2 vs. control 3 in A. P < 0.01 for probe 2 vs. control 3 in B and C.