
Table 2.
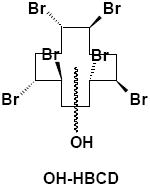
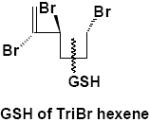
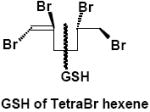
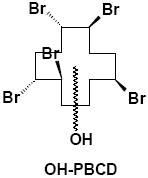
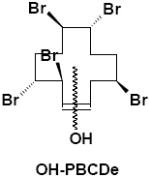
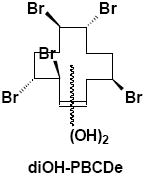
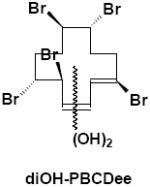
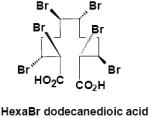
Structures of fecal metabolites from mice exposed to α-[14C]HBCD or γ-[14C]HBCD characterizied by LC/MS (ESI-).
| Metabolites of α-HBCD | Compartment | Abbreviation | # Isomers | M-H (nominal) |
|---|---|---|---|---|
|
| ||||
|
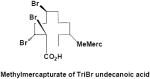
Liver, Brain, Adipose | α-M1 | 1 | 650.6 |
| Feces | 4 | |||
|
| ||||
|
Urine | α-M2 | 1 | 621.6 |
|
| ||||
|
Urine | α-M3 | 1 | 697.5 |
|
| ||||
| Metabolites of γ-HBCD | ||||
|
| ||||
|
Liver, Adipose | γ-M4 | 1 | 572.6 |
|
| ||||
|
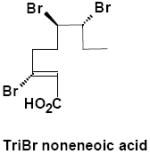
Feces | γ-M5 | 4 | 570.6 |
|
| ||||
|
Feces | γ-M6 | 3 | 588.6 |
|
| ||||
|
Feces | γ-M7 | 2 | 586.6 |
|
| ||||
|
Urine | γ-M8 | 3 | 696.8 |
|
| ||||
|
Feces | γ-M9 | 1 | 563.3 |
|
| ||||
|
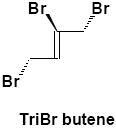
Urine | γ-M10 | 1 | 388.8 |
|
| ||||
|
Urine (volatile) | γ-M11 | 1 | 284.9 |