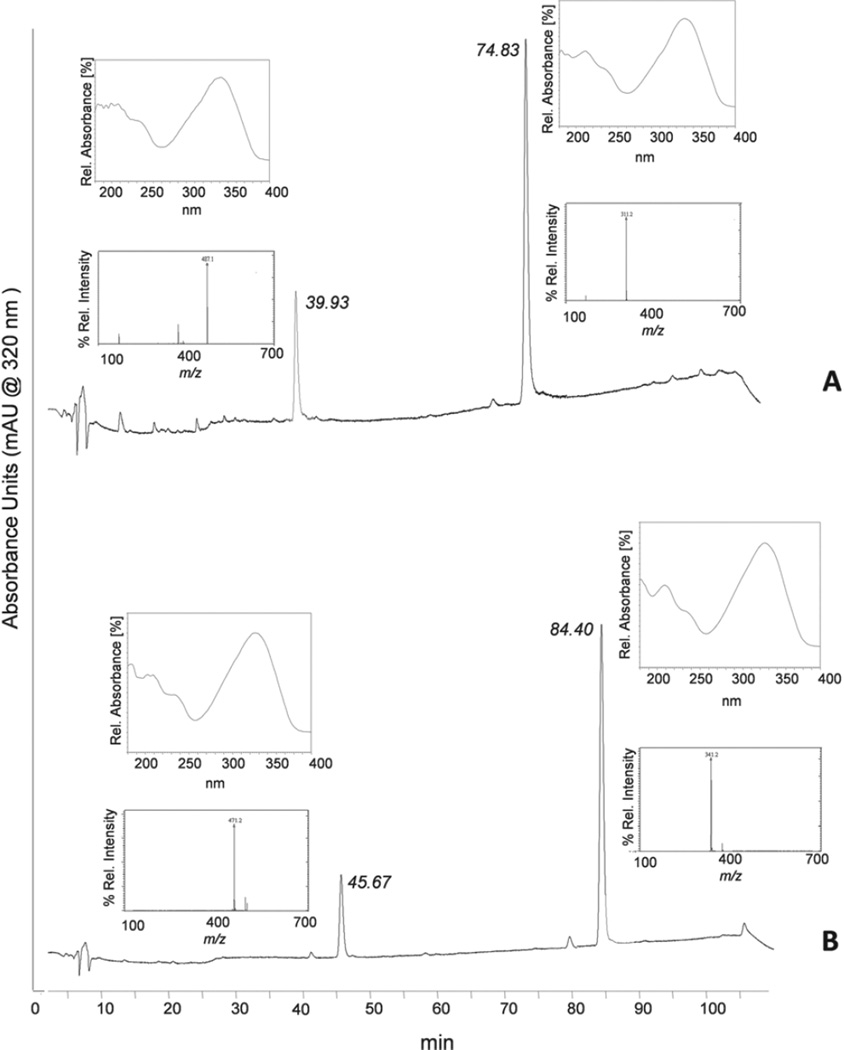
Figure 3.
Analysis of trans-arachidin-1 (tA1) and trans-arachidin-3 (tA3) glucuronidated products produced by UGT1A7. Aliquots of the glucuronidation reaction products were analysed by reverse-phase HPLC-PDA and LC-MS. HPLC profiles were monitored at 320 nm. The MS analysis was carried out using electrospray ionisation (ESI) under negative ion mode. HPLC profiles show peaks of (A) tA1 (Rt: 74.83 min) and tA1 glucuronide (Rt: 39.93 min) and (B) tA3 (Rt: 84.40 min) and tA3 glucuronide (Rt: 45.67). Inserts next to these peaks show their UV spectrum (above) and mass spectrum (below).

