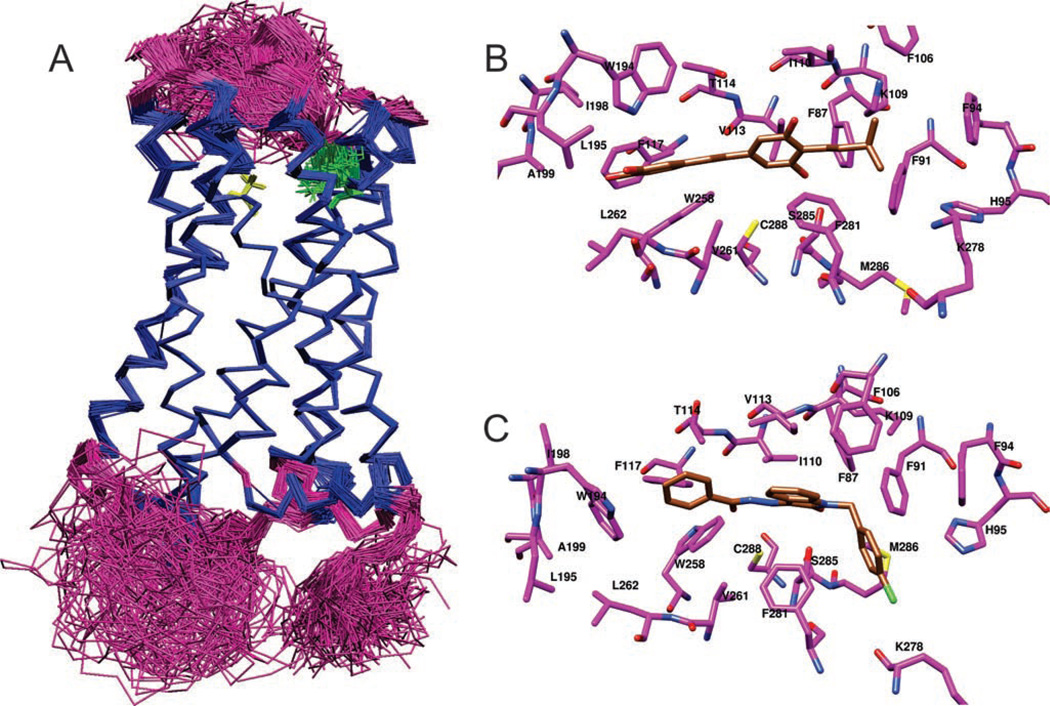
Figure 6.
The conformational diversity observed in models generated using Modeller software, represented by a superposition of 132 CB2R structures. (A) The helical and non-helical regions of the backbone are rendered as blue and magenta trace, respectively. Variations in the side-chain conformation of K109 and S285 are shown as green and yellow sticks, respectively. Snapshot rendered using VMD (Visual Molecular Dynamics) (Humphrey et al. 1996). Putative binding pose of (B) tA1 and (C) an N-alkyl isatin benzohydrazide, bound to CB2R. The carbon atoms of the ligand and CB2R are rendered in gold and magenta, respectively, with nitrogen in blue, oxygen in red and sulphur in yellow. Snapshots rendered using the UCSF Chimera package from the Resource for Biocomputing, Visualisation and Informatics at the University of California, San Francisco (Pettersen et al. 2004).

