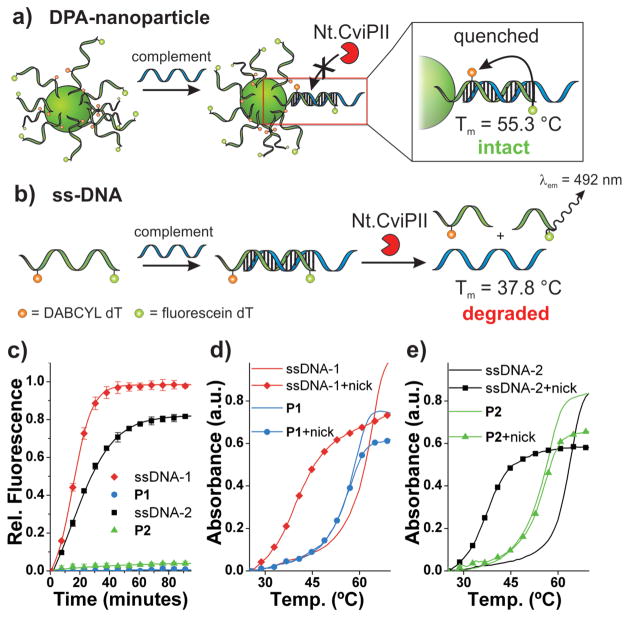
Figure 2.
Endonuclease resistance of DPA nanoparticles. a) Scheme depicting DPA-nanoparticle (P2) resistance to nicking endonuclease (Nt.CviPII) and consequently intact, quenched duplex DNA at the particle surface. b) Scheme depicting dsDNA degradation by Nt.CviPII and consequently a decrease in duplex melting temperature and increase in fluorescein fluorescence. c) Nt.CviPII activity over time, monitored via fluorescein fluorescence dequenching (λex = 485 nm, λem = 535 nm). d) Thermal denaturation analysis with and without Nt.CviPII treatment for P1 and ssDNA-1. λabs = 260 nm. Sample subjected to enzyme for 100 minutes at 37 °C. ssDNA-1 + Complement: Tm = 63.9 °C; ssDNA-1 + Nt.CviPII + Complement: Tm = 37.8 °C; P1 + Complement: Tm = 58.8 °C; P1 + Nt.CviPII + Complement: Tm = 58.3 °C). e) Thermal denaturation analysis with and without Nt.CviPII treatment for P2 and ssDNA-2. λabs = 260 nm. Sample subjected to enzyme for 100 minutes at 37 °C. ssDNA-2 + Complement: Tm = 63.9 °C; ssDNA-2 + Nt.CviPII + Complement: Tm = 37.8 °C; P2 + Complement: Tm = 56.9 °C; P2 + Nt.CviPII + Complement: Tm = 55.3 °C). See Supporting Information Figure S12 for derivative plots of melting temperatures. Complement: 5′-TATTATATCTTTAGACACTGA CTGGACATGACTCT-3′

