
Figure 3. Comparison of Cdkn2a wild-type vs. heterozygote vs. KO.
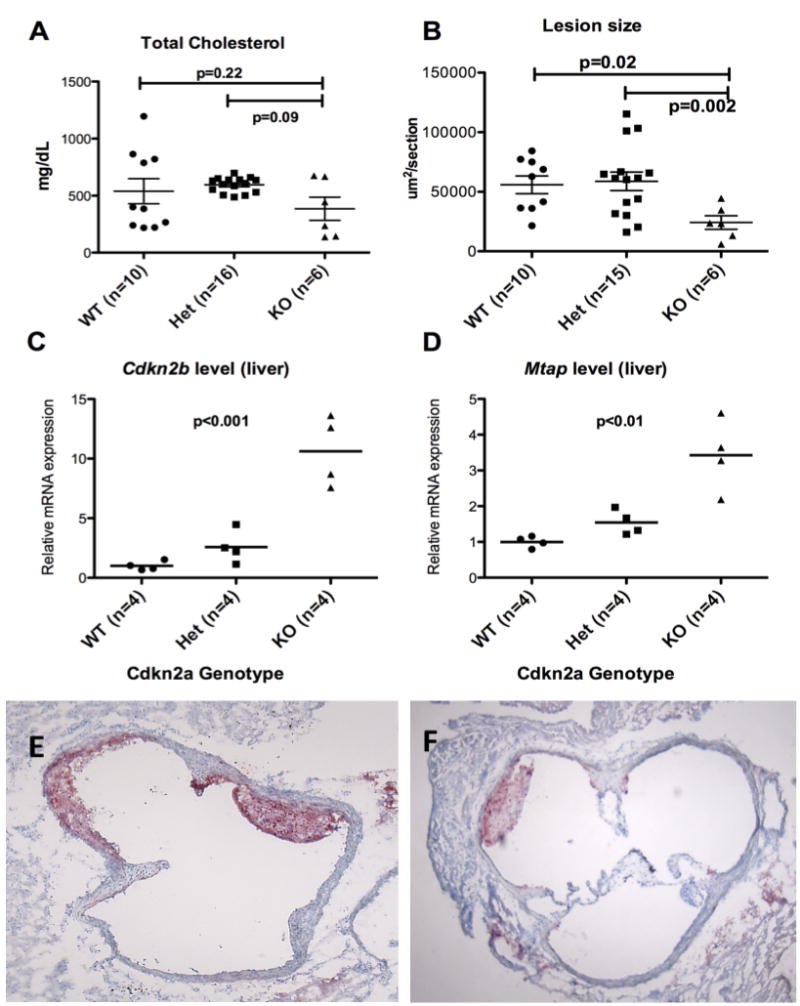
A. Total cholesterol levels; B. Aortic sinus lesion size on Oil red O staining. The KO group had smaller lesion size compared to the WT and Het groups; C. The relative Cdkn2b mRNA expression levels in liver by qPCR (p<0.001); D. The relative Mtap mRNA expression levels in liver by qPCR (p<0.01). The levels of Cdkn2b and Mtap are inversely correlated to the level of p16Ink4a and p19Arf, compensating for the loss of Cdkn2a gene; E and F. Oil red O staining of WT and KO lesions, respectively. Staining of lesions with CD68 showed that the lesions were nearly all macrophages in content (Data not shown).