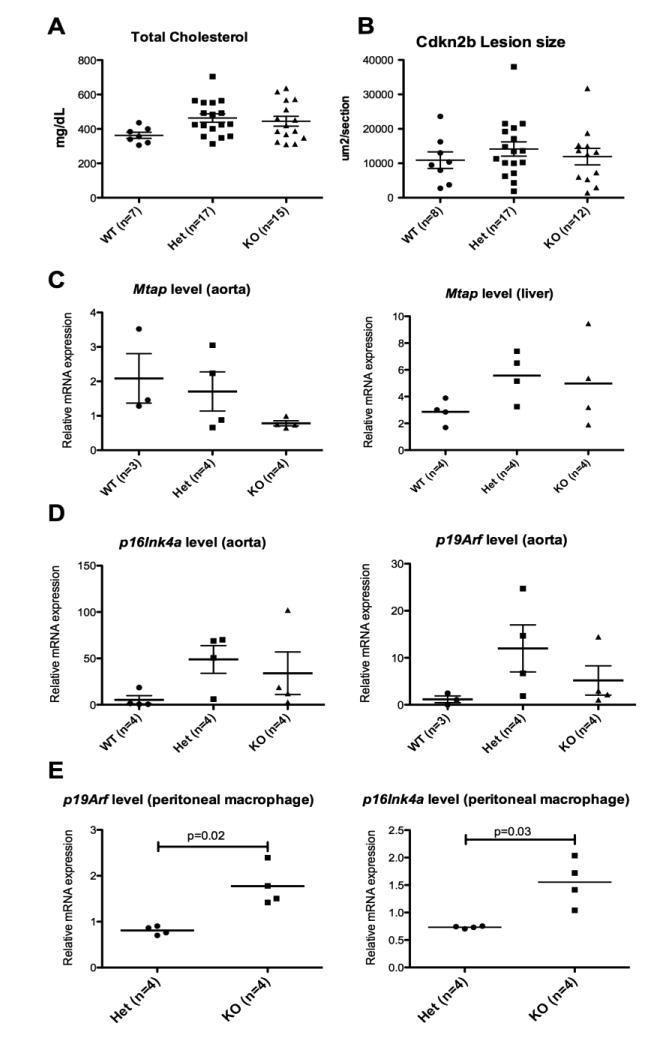
Figure 5. Comparison of Cdkn2b WT vs. heterozygote vs. KO.
A. Total fasting cholesterol at time of sacrifice; B. Aortic sinus lesion size; C. MTAP expression in aorta (left) and liver (right); D and E. p16Ink4a (left) and p19Arf (right) expression levels in aorta and peritoneal macrophages, respectively.

