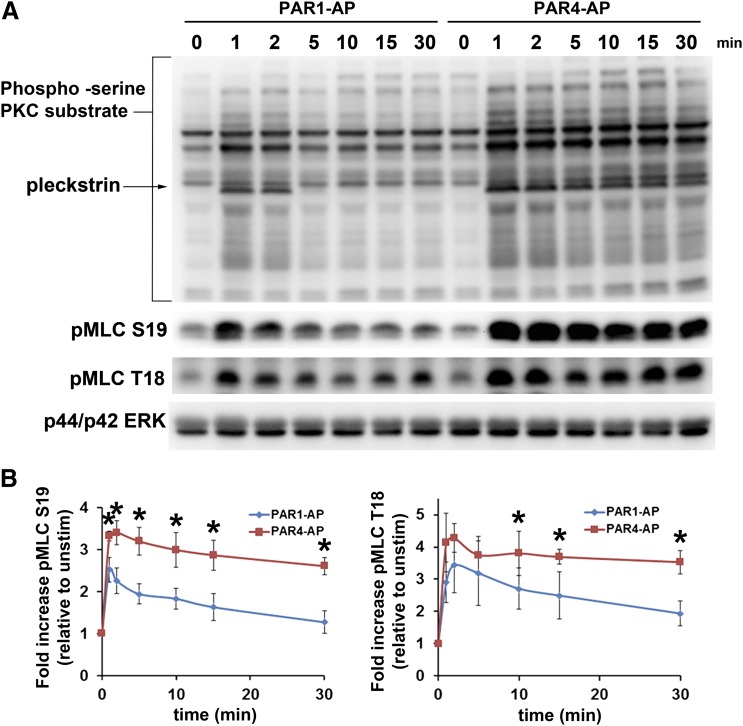
Fig. 4.
Regulation of myosin light chain phosphorylation by PAR-stimulated platelets. (A) PAR1- and PAR4-mediated PKC (s) substrate phosphorylation and myosin light chain phosphorylation at S19 (pMLC S19) and T18 (pMLC T18). Platelets were stimulated with 20 μM PAR1-AP and 200 μM PAR4-AP for the indicated periods. Reactions were stopped, and samples were prepared for Western blot analysis as indicated in Materials and Methods. Top panel, PKC (s)-substrate; middle panels, pMLC S19 and T18; lower panel, p44/p42 ERK loading controls. (B) Quantification of pMLC S19 and T18. Data were collected from three independent experiments and analyzed using Image J. Data are expressed as fold increase relative to the density of bands in unstimulated lanes. Asterisks indicate statistically significant differences between PAR1-AP– and PAR4-AP–stimulated MLC phosphorylation at the indicated time point with use of a paired t test. P values (S19, 1 minute = 0.0173, 2 minute = 0.008, 5 minute = 0.0133, 10 minute = 0.0222, 15 minute = 0.017, 30 minute = 0.0038; T18, 10 minute, 0.0049, 15 minute = 0.0471, 30 minute = 0.0498)

