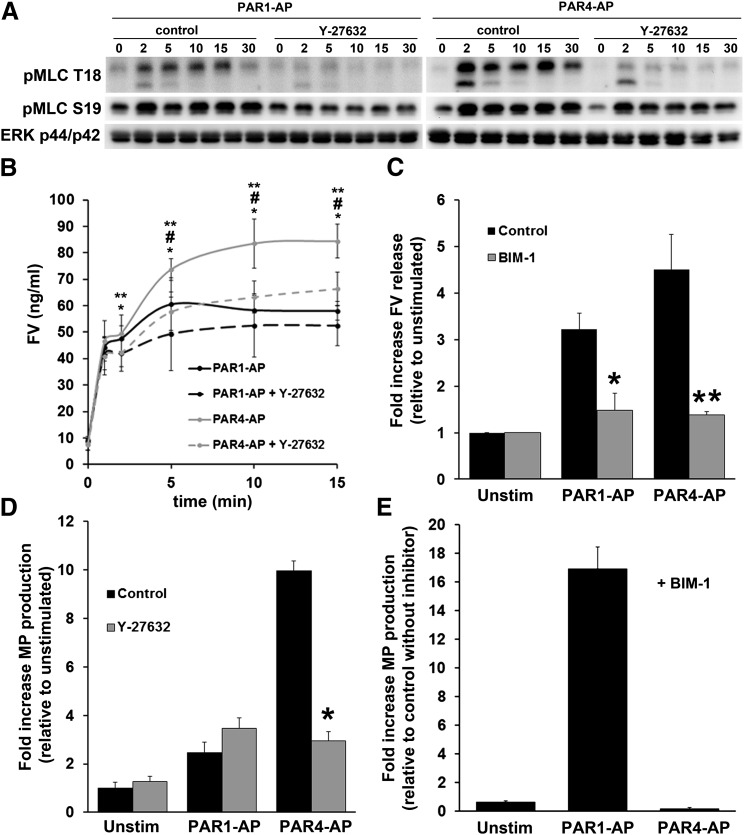
Fig. 5.
The effect of PKC inhibition and Rho-kinase inhibition on platelet secretion and microparticle production. (A) The effect of Y-27632 on S19 and T18 pMLC. Platelets were preincubated with 10 μM Y-27632 or water for 10 minutes before stimulation with 20 μM PAR1-AP or 200 μM PAR4-AP for the indicated periods. (B) The effect of Rho-kinase inhibitor on PAR-mediated FV release. Platelets were preincubated with 10 μM Y-27632 for 10 minutes before stimulation with 20 μM PAR1-AP or 200 μM PAR4-AP for the indicated periods, and supernatants were prepared for sandwich ELISA, as indicated in Materials and Methods. Shown are the means and S.E.M. (n = 3). Paired t test *PAR4-AP versus PAR4-AP + Y-27632, #PAR4-AP versus PAR1-AP, **PAR4-AP versus PAR1-AP + Y-27632. 1 minute *P value = 0.0327; 2 minute *P value = 0.017, **P value = 0.0117; 5 minute *P value = 0.0123, **P value = 0.0463; 10 minute *P value = 0.048, #P value = 0.0145, **P value = 0.0072; 15 minute *P value = 0.0002, #P value = 0.0203, **P value = 0.0031. C. The effect of PKC inhibitor on PAR-mediated FV secretion. Platelets were preincubated with 10 μM BIM-1 or DMSO for 10 minutes before stimulation with 20 μM PAR1-AP or 200 μM PAR4-AP for 15 minutes. Shown are the means and S.E.M. (n = 4). Paired t test, PAR1-AP versus PAR1-AP + BIM-1 *P = 0.0312, PAR4-AP versus PAR4-AP + BIM-1. **P = 0.016. Raw values for FV concentration: unstimulated, 22.7 ± 4.2 ng/ml; unstimulated+BIM-1, 21.4 ± 3.8 ng/ml; PAR1-AP, 68.9 ± 8.1 ng/ml; PAR1-AP+BIM-1, 34.7 ± 12.5 ng/ml; PAR4-AP, 93.3 ± 7.8 ng/ml; PAR4-AP+BIM-1, 30.1 ± 6.3. (D) The effect of Rho-kinase inhibitor on PAR-mediated microparticle production. Platelets were preincubated with 10 μM Y-27632 for 10 minutes before stimulation with 20 μM PAR1-AP or 200 μM PAR4-AP for 30 minutes. Microparticle-enriched supernatants were prepared as indicated in Materials and Methods. Shown are the means with S.E.M. (n = 3). A paired t test comparing PAR4-AP with PAR4-AP+Y-27632 revealed statistically significant differences. *P = 0.0024. A paired t test comparing PAR1-AP with PAR1-AP+Y-27632 did not demonstrate statistically significant differences (P = 0.117). A paired t test comparing PAR1-AP with PAR4-AP showed statistically significant differences (P = 0.002). Raw values for microparticle production (dual positive particles): unstimulated, 79.5 ± 18.4; unstimulated+Y-27632, 77.6 ± 15.6; PAR1-AP, 164.9 ± 31.3; PAR1-AP+Y-27632, 269.4 ± 57.8; PAR4-AP, 769.0 ± 151.2; PAR4-AP+Y27632, 216.8 ± 29.9. (E) The effect of PKC inhibitor on PAR-mediated microparticle production. Platelets were preincubated with 10 μM BIM-1 for 10 minutes before stimulation with 20 μM PAR1-AP or 200 μM PAR4-AP for 30 minutes. Microparticle-enriched platelet supernatants were prepared as indicated in Materials and Methods. Shown are the means with S.E.M. (n = 4). Raw values for microparticle production (dual positive particles): unstimulated, 120.1 ± 15.5; unstimulated+BIM-1, 76.1 ± 8.6; PAR1-AP, 300.6 ± 71.9; PAR1-AP+BIM-1, 5092.2 ± 1662.1; PAR4-AP, 821.5 ± 332.5; PAR4-AP+BIM-1, 139.3 ± 33.6.

