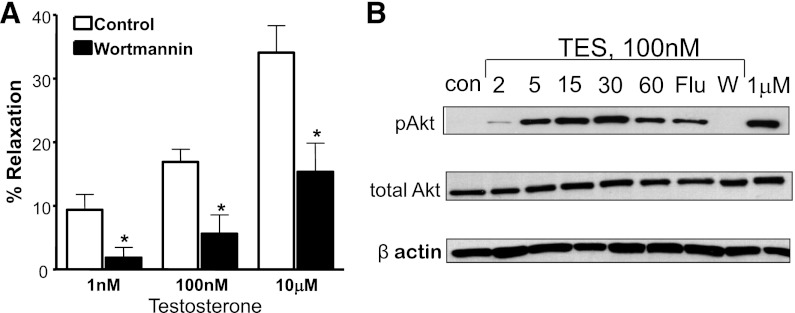
Fig. 5.
TES activates PI3 kinase-Akt signaling in mesenteric microvessels. (A) TES-induced microvascular relaxation in the absence (control) or presence of 50 nM Wortmannin (n = 5). Each bar represents the mean response ± S.E. *P < 0.001 compared with TES alone. (B) Representative time-course (2–60 minute, as labeled) immunoblot of 100 nM TES-stimulated phosphorylation of Akt (p-Akt; top panel; n = 3). The effect TES treatment was also measured in the presence of 10 μM flutamide (Flu) or 50 nM Wortmannin (W), as was the effect of 1 μM TES alone (right lane). Middle panel reveals total Akt. β-actin was detected to control for protein loading (lower panel).

