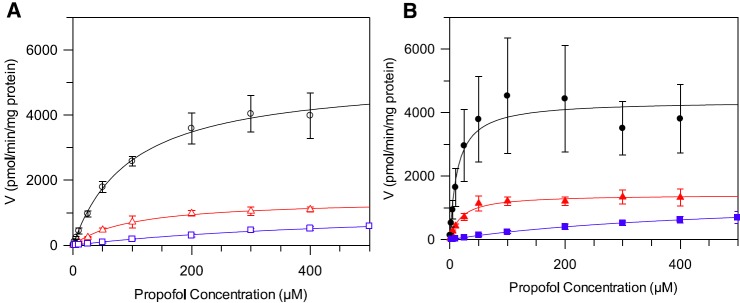
Fig. 2.

Formation rate plots for propofol glucuronide as a function of substrate concentration in alamethicin activated human hepatic, renal, and intestinal microsomes in the presence and absence of 2% BSA. Data represent the mean of three experiments, each performed in duplicate. Error bars represent the standard deviation. (A) Data generated in the absence of BSA. (B) Data generated in the presence of BSA. △, ○, and □ represent propofol glucuronide formation in hepatic, renal, and intestinal microsomes, respectively.
