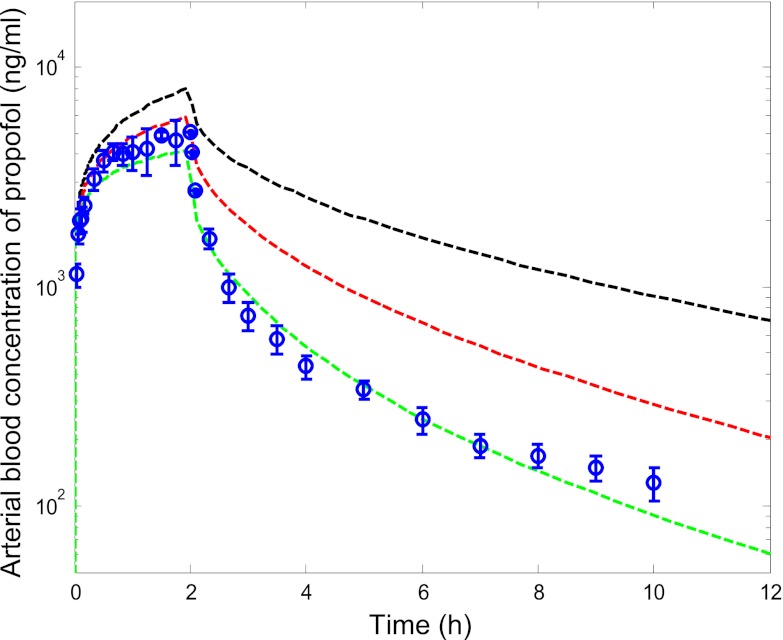
Fig. 3.
Predicted blood concentration-time profiles for propofol using optimized liver and kidney in vitro CLint,u data derived from microsomes in the presence of BSA. ○ represent mean ± S.D. observed blood concentration-time data for the 18 mg/kg dose level from Gepts et al. (1987). Black line represents predicted concentrations using in vitro CLint data from the substrate depletion microsomal assays (in the presence of BSA) without optimization; red line represents predicted concentrations using optimized kidney CLint,UGT data; and green line represents predicted concentrations using optimized CLint data for both liver and kidney.

