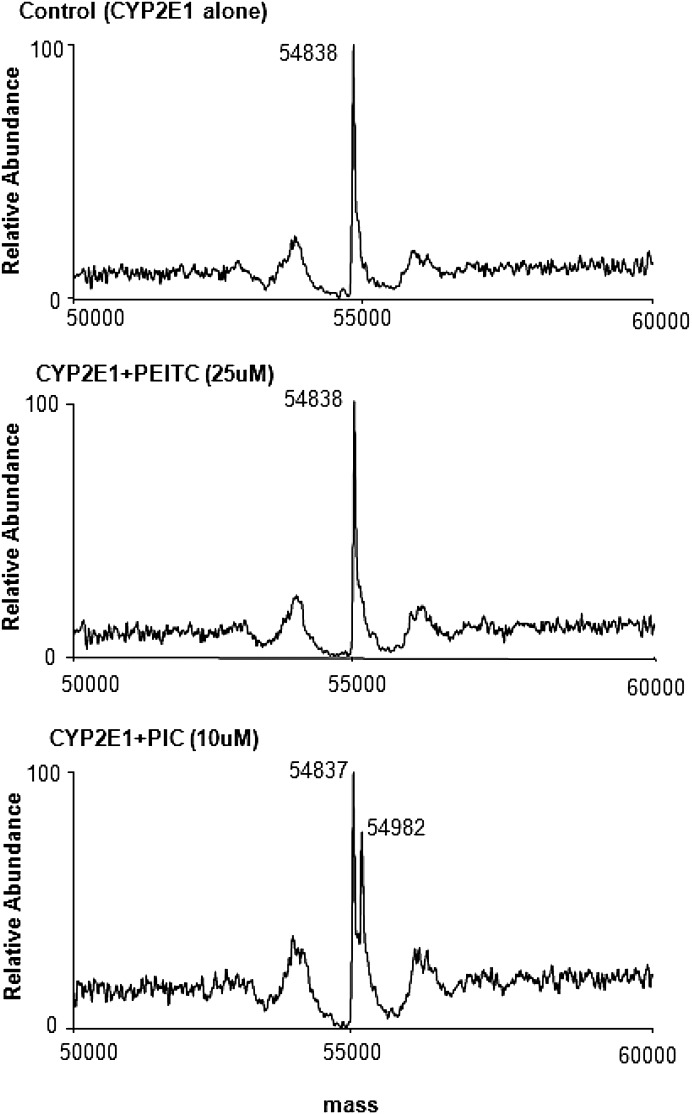
Fig. 7.
ESI LC-MS/MS analysis of the protein adduct of PIC with CYP2E1. Incubations and separations were as described under Materials and Methods. Data represent the deconvoluted spectrum of the CYP2E1 sample containing methanol (control, upper panel), 25 μM PEITC (middle panel), and 10 μM PIC (lower panel). The control and the sample incubated with PEITC show only the nonadducted CYP2E1 (54,838 Da), and the sample incubated with PIC exhibits both nonadducted (54,837 Da) and PIC-adducted CYP2E1 (54,982 Da).

