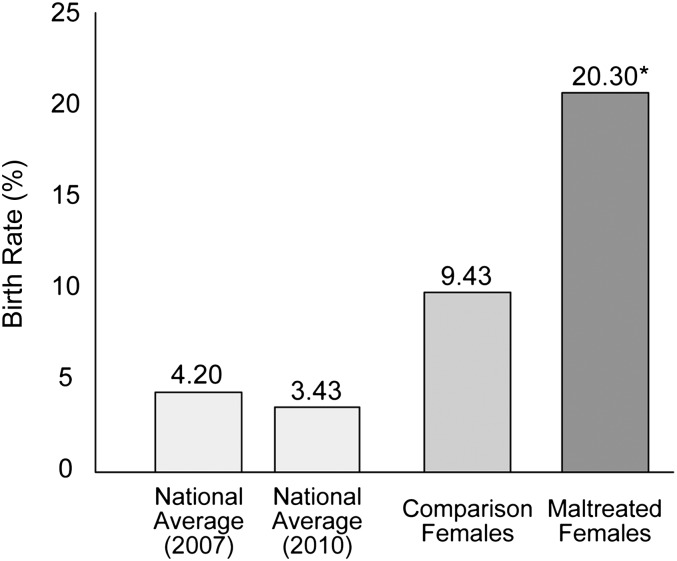
FIGURE 1.
Birth rates for maltreated and comparison females in relation to the US national averages for 2007 and 2010. *Significantly different from the comparison group (OR = 2.17 [95% CI, 1.71–4.01]; P = .01); age at study entry, family income level, minority status, level of sexual activity, and contraceptive use covaried.

