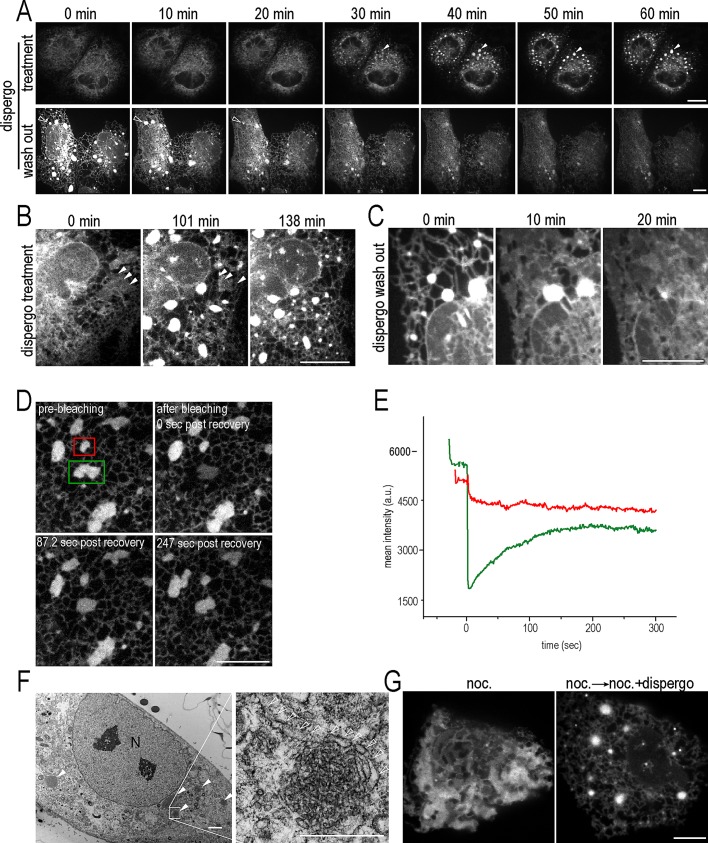
FIGURE 3:
Effect of dispergo on the dynamics and morphology of the ER. (A) The effects of dispergo are reversible. Two-dimensional time-lapse series of BSC1 cells stably expressing GFP-Sec61β treated with dispergo for 1 h, showing the gradual appearance of ER patches (top, solid arrowheads; see Supplemental Movie S1). After a further 2-h incubation with dispergo, the compound was removed (bottom). The time-lapse series shows the gradual disappearance of the ER patches (bottom, open arrowheads; see Supplemental Movie S2). (B, C) Two-dimensional time-lapse series from BSC1 cells expressing mRFP1-Sec61β (B) or GFP-Sec61β (C). The images in B highlight the disappearance of ER cisternae (arrowheads) and appearance of ER patches upon dispergo treatment. The images in C are from an enlarged region of A, bottom, and show the reversal of these effects upon removal of dispergo. Scale bars, 10 μm. (D) Rapid exchange of GFP-Sec61β within ER patches and with adjacent ER. The images are from a FRAP experiment conducted on an ER patch (green box) in a BSC1 cell stably expressing GFP-Sec61β pretreated with dispergo for 3 h (see Supplemental Movie S3). The ER patch within the unbleached region (red box) was used as a FRAP control. Scale bar, 10 μm. (E) Quantification of the mean fluorescence intensity within the boxed regions of the FRAP experiment. (F) Example of electron microscopy images obtained from BSC1 cells treated with dispergo for 3 h in the absence of ectopic expression of proteins. Left, ER patches highlighted with solid arrowheads. N, nucleus. Scale bar, 2 μm. Right, enlarged highlights of the abundance of relatively circular small membrane profiles contained within the ER patches; membrane profiles ∼100 nm in width extending away from the ER patches are highlighted with open arrowheads. Scale bar, 500 nm. (G) Dispergo induces ER tubules and patches in the absence of microtubules. BSC1 cells stably expressing GFP-Sec61β were first treated with nocodazole for 2 h (left), followed by nocodazole and dispergo for an additional 2 h. Scale bar, 10 μm. All fluorescence images were acquired live using spinning disk confocal microscopy.

